TradeAdapt Markets
DAILY & WEEKLY STRUCTURE.
EVERY MARKET.
The Multi-Adaptive FIB+ATR+VOL system. Futures, forex, crypto, indices — one dashboard, structural levels everywhere.
$100/month · Cancel anytime · Version 2.2
Watch the Video Breakdown
See how Multi-Timeframe Adaptive Fibonacci works in real-time
How Markets Works
TradingView Calculates
The Multi-Adaptive FIB strategy runs on TradingView, calculating Monthly, Weekly, Daily, and 4-Hour levels in real-time across any market you configure.
Webhook Sends Data
Every bar close, the strategy sends structured JSON data via webhook to our secure endpoint, including all levels, colors, alignment states, and target zones.
Dashboard Displays
Access your levels via the web dashboard or the Markets desktop app. Real-time updates, audio alerts, multi-market monitoring, and file output for NinjaTrader, MT5, cTrader, and TradingView.
The Edge: What You’re Actually Seeing
This isn’t just another Fibonacci tool. Here’s what makes it different.
It’s Not Predictive — It’s Reactive
Most trading systems try to predict what will happen next. This system doesn’t predict anything. It observes structure, calculates adaptive levels based on that structure, and shows you when alignment exists or doesn’t exist.
You’re not guessing. You’re reading what’s already there.
It Adapts to Market Structure
Traditional Fibonacci tools draw levels from historical swing points and leave them static. Those levels get stale as market structure evolves.
Adaptive Fib recalculates continuously as new ranges form. When price breaks out of old structure and establishes new structure, the levels adjust. You’re always seeing current structure, not yesterday’s structure.
Multi-Timeframe Context
Most traders look at one timeframe and make decisions. Professional traders look at multiple timeframes and wait for confirmation.
This system gives you Monthly, Weekly, Daily, and 4-Hour structure on a single view. When timeframes agree, you have an edge. When they conflict, you have confusion — avoid it.
Dashboard Features
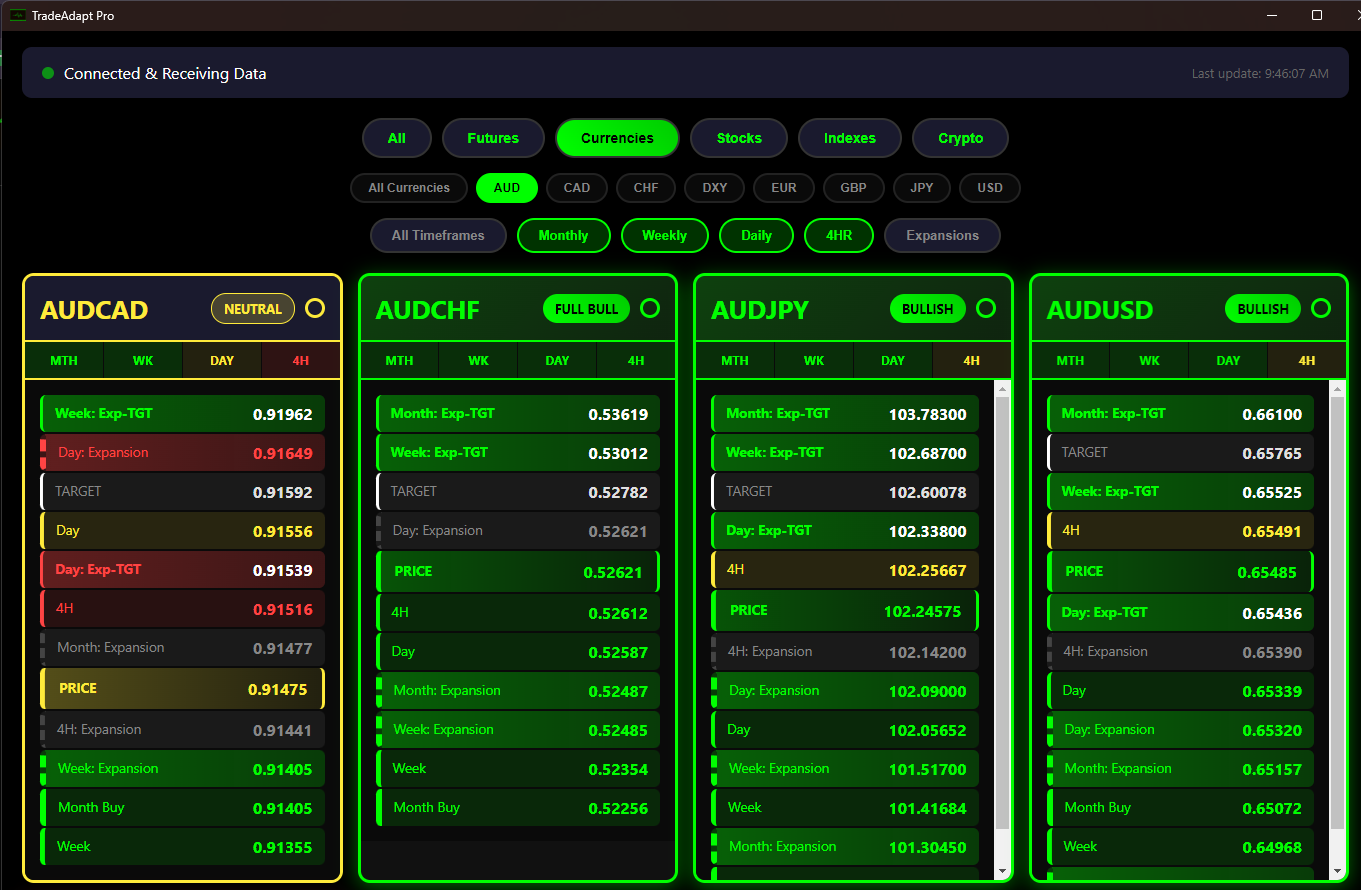
Multi-Market Monitoring
Track dozens of markets simultaneously. Futures, Forex, Crypto, Stocks — all on one screen. Each market card shows the complete adaptive structure with color-coded timeframe alignment.
- Futures: ES, NQ, YM, RTY, CL, GC, and more
- Forex: EURUSD, GBPUSD, USDJPY, all major pairs
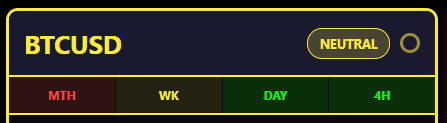
- Crypto: BTC, ETH, and popular altcoins
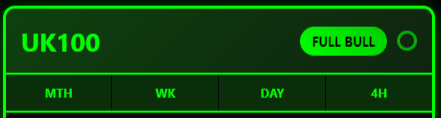
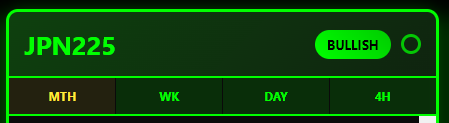
- Global Indices: DAX, FTSE, Nikkei, ASX
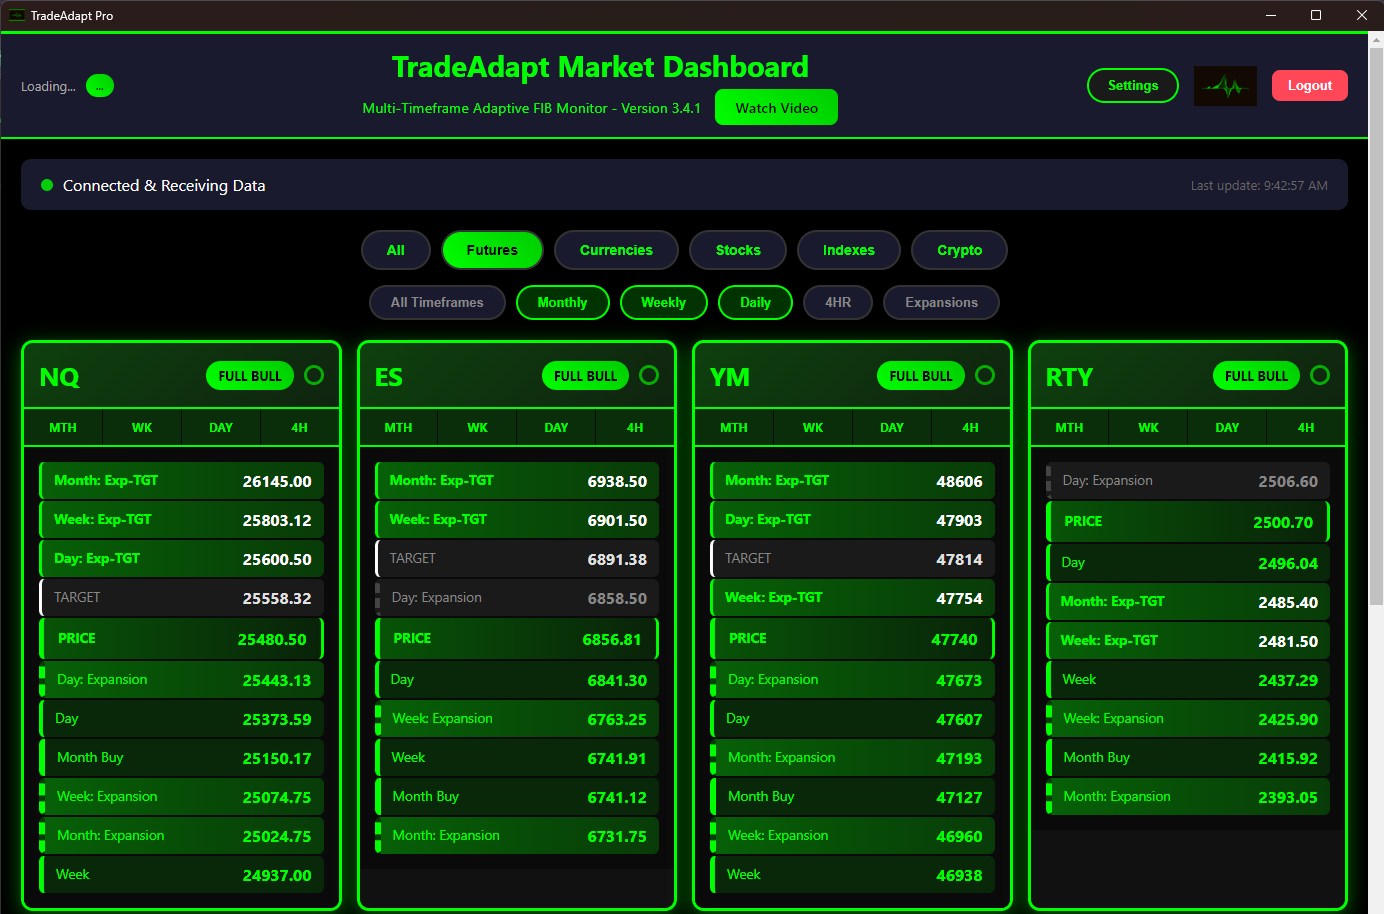
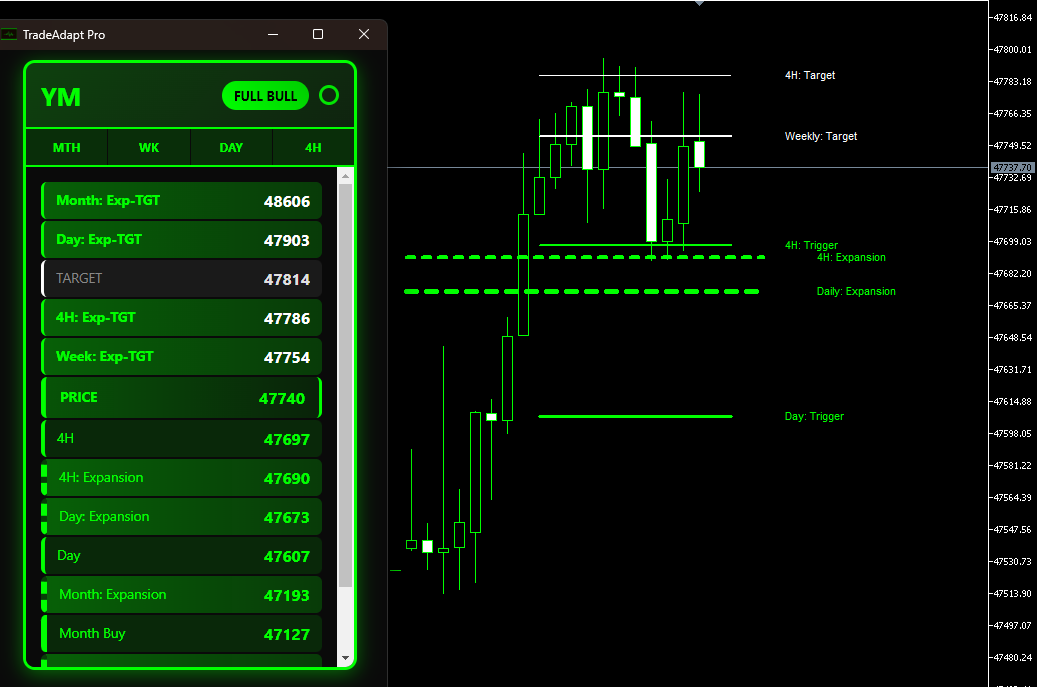
Price Stack Display
Every market card shows a sorted price stack from highest to lowest. Current price is highlighted with the corresponding bias color. Instantly see where price sits relative to all key levels.
- Monthly Buy/Sell/Mid levels
- Weekly trigger lines
- Daily and 4H execution levels
- Expansion zones (BKP) and 100% targets

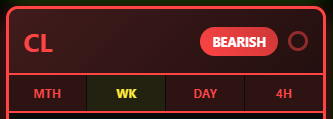
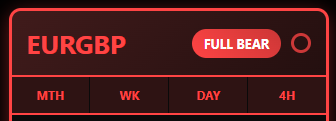
Timeframe Alignment Badges
Each market shows its alignment state at a glance. When Monthly, Weekly, and Daily all agree, you have maximum conviction. The badge tells you instantly.
Currency Pair by Currency Filtering
Trading forex? Filter your dashboard by currency base to see all related pairs at once. Click a currency filter and instantly view all pairs with that base.
- AUD — AUDUSD, AUDCAD, AUDJPY, AUDNZD…
- EUR — EURUSD, EURGBP, EURJPY, EURCHF…
- GBP — GBPUSD, GBPJPY, GBPAUD, GBPCAD…
- USD — All USD-based pairs grouped together
Perfect for currency-focused traders who want to see strength/weakness across an entire currency.
Markets Desktop App
Professional-grade desktop application for serious traders. All the dashboard features plus advanced functionality.
Audio Alerts
Customizable sound alerts for timeframe changes, full alignment, and expansion activations. Never miss a setup.
File Output
Export levels to text files for NinjaTrader, MT5, and cTrader indicators. Bridge TradingView data to any platform.
Pop-Out Windows
Detach individual market cards to their own windows. Perfect for multi-monitor setups.
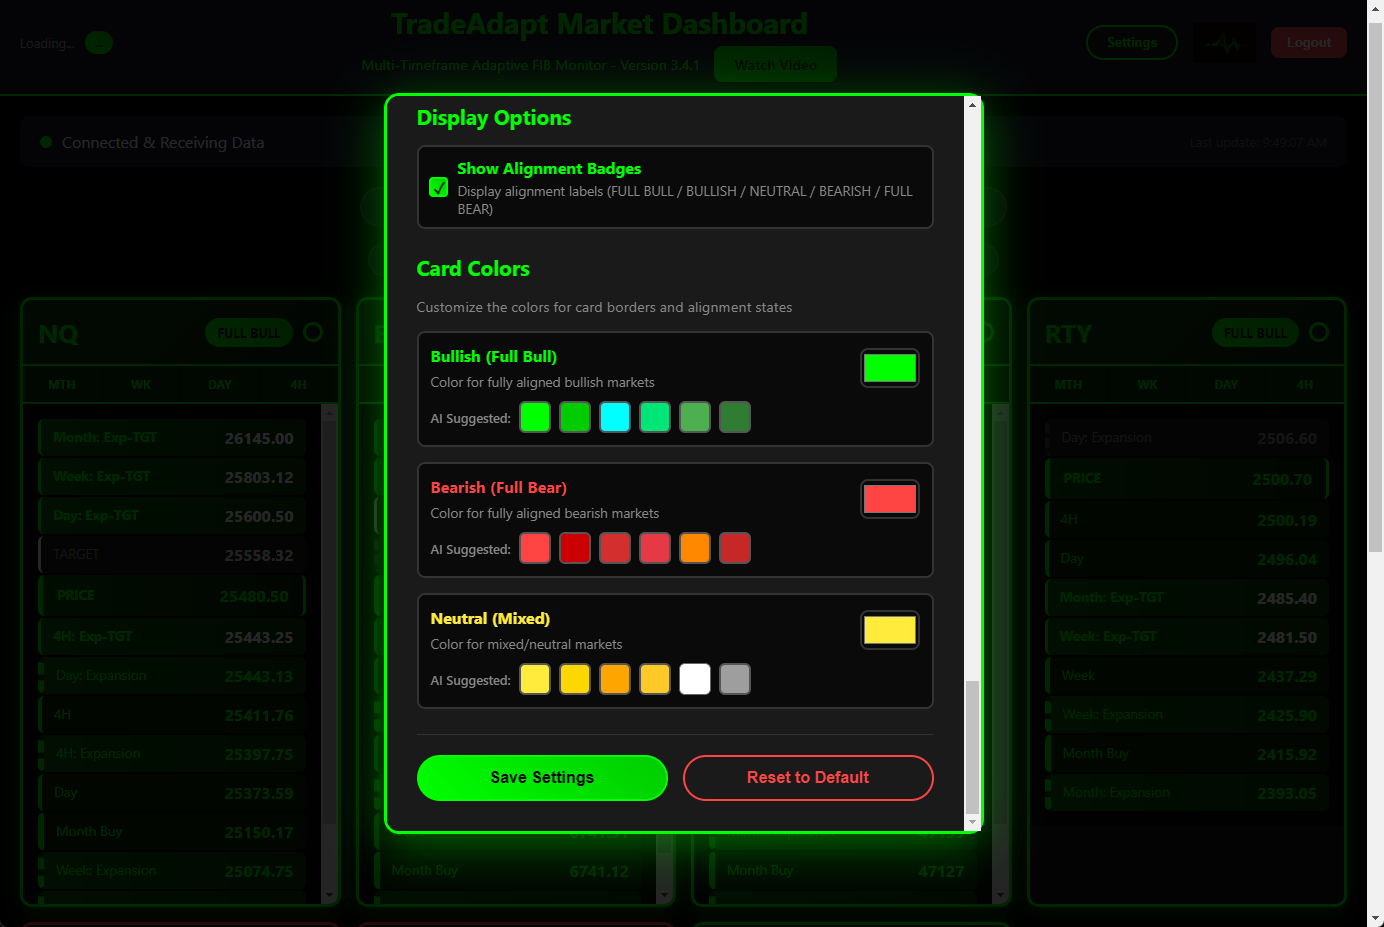
Customization
Card sizes, color schemes, market filtering, and more. Make it yours.
Color Customization
Choose your own colors for bullish, bearish, and neutral states. Match your trading setup or personal preference.
Alert Filtering
Configure exactly which alerts you want to hear. Filter by timeframe, alignment type, and specific instruments.

Plot the Levels on Your Trading Platform
Markets calculates levels once on TradingView, then streams them to chart-plotting indicators on every platform you trade. NinjaTrader, MetaTrader 5, cTrader, and TradingView indicators are all included with your subscription — no separate purchases.
Calculates Multi-Adaptive FIB levels
Writes levels to shared file
Indicator reads file, plots levels
Each platform indicator reads the same shared file location and renders the structural levels natively, with the platform’s own drawing tools and customization. Same data, every chart.
What Gets Plotted on Every Chart
8 Timeframe Levels
Yearly, Quarterly, Monthly, Weekly, Daily, 4H, 1H, 15M. Each timeframe carries Buy / Mid / Sell, Expansion, Target, and Next Target prices.
Color-Coded State
Each timeframe rendered in its bias color (green = bullish, red = bearish, yellow = neutral). Active expansions render bolder; inactive levels stay subtle.
KC + KC50 Channel Lines
Keltner-style channel lines per timeframe (Weekly through 15M), with dashed inner band at the 50% midpoint. Gray neutral until structure engages.
Width Scales by Timeframe
Larger timeframes draw thicker lines (Yearly = 8px, Quarterly = 6px, Monthly = 5px, all the way down to 4H = 1px). Visual hierarchy at a glance.
Volume Bubble Engagement
When price engages a key level, a volume bubble accumulates net delta until disengagement. Bubble size scales with notional volume; color shows bull/bear pressure that defended or attacked.
One-Click Timeframe Filtering
On-chart toggle buttons: All / Year / Qtr / Month / Week / Day / 4H. Show only the timeframes you trade. KC and KC50 lines toggle independently.
Per-Platform Indicator
NinjaTrader (NT8)
Native C# indicator. Persistent KC plots, on-chart toggle buttons, SharpDX-rendered volume bubbles. Drop into your Indicators folder, point at the shared file path, ready to trade.
MetaTrader 5
Native MQL5 indicator. Same 8-timeframe level set, same color coding, same toggle controls adapted to MT5’s chart UI. File is read from MetaQuotes\Terminal\Common\Files — the standard MT5 shared folder.
cTrader
Native cAlgo indicator (C#). Reads the same shared file, plots the same 8 timeframes with cTrader’s drawing system. Forex and CFD traders get the same Multi-Adaptive FIB framework futures traders use.
TradingView
Pine Script indicator that displays the same levels TradingView calculated — the source of truth, available on TradingView Web, Desktop, and Mobile. Cross-platform without the file-bridge step.
Conditional Cascade Display
Levels Cascade by Timeframe State
All four platform indicators implement the same cascade logic as the TradingView source. Monthly levels always display. Weekly visibility cascades from Monthly state. Daily cascades from Weekly. 4H cascades from Daily. The chart only shows what’s actually relevant given higher-timeframe structure.
Expansion + Target Highlighting
When an expansion is active (has a directional target), line width increases and color intensifies. Inactive expansions render as subtle gray. The bolder a line draws, the more conviction it carries.
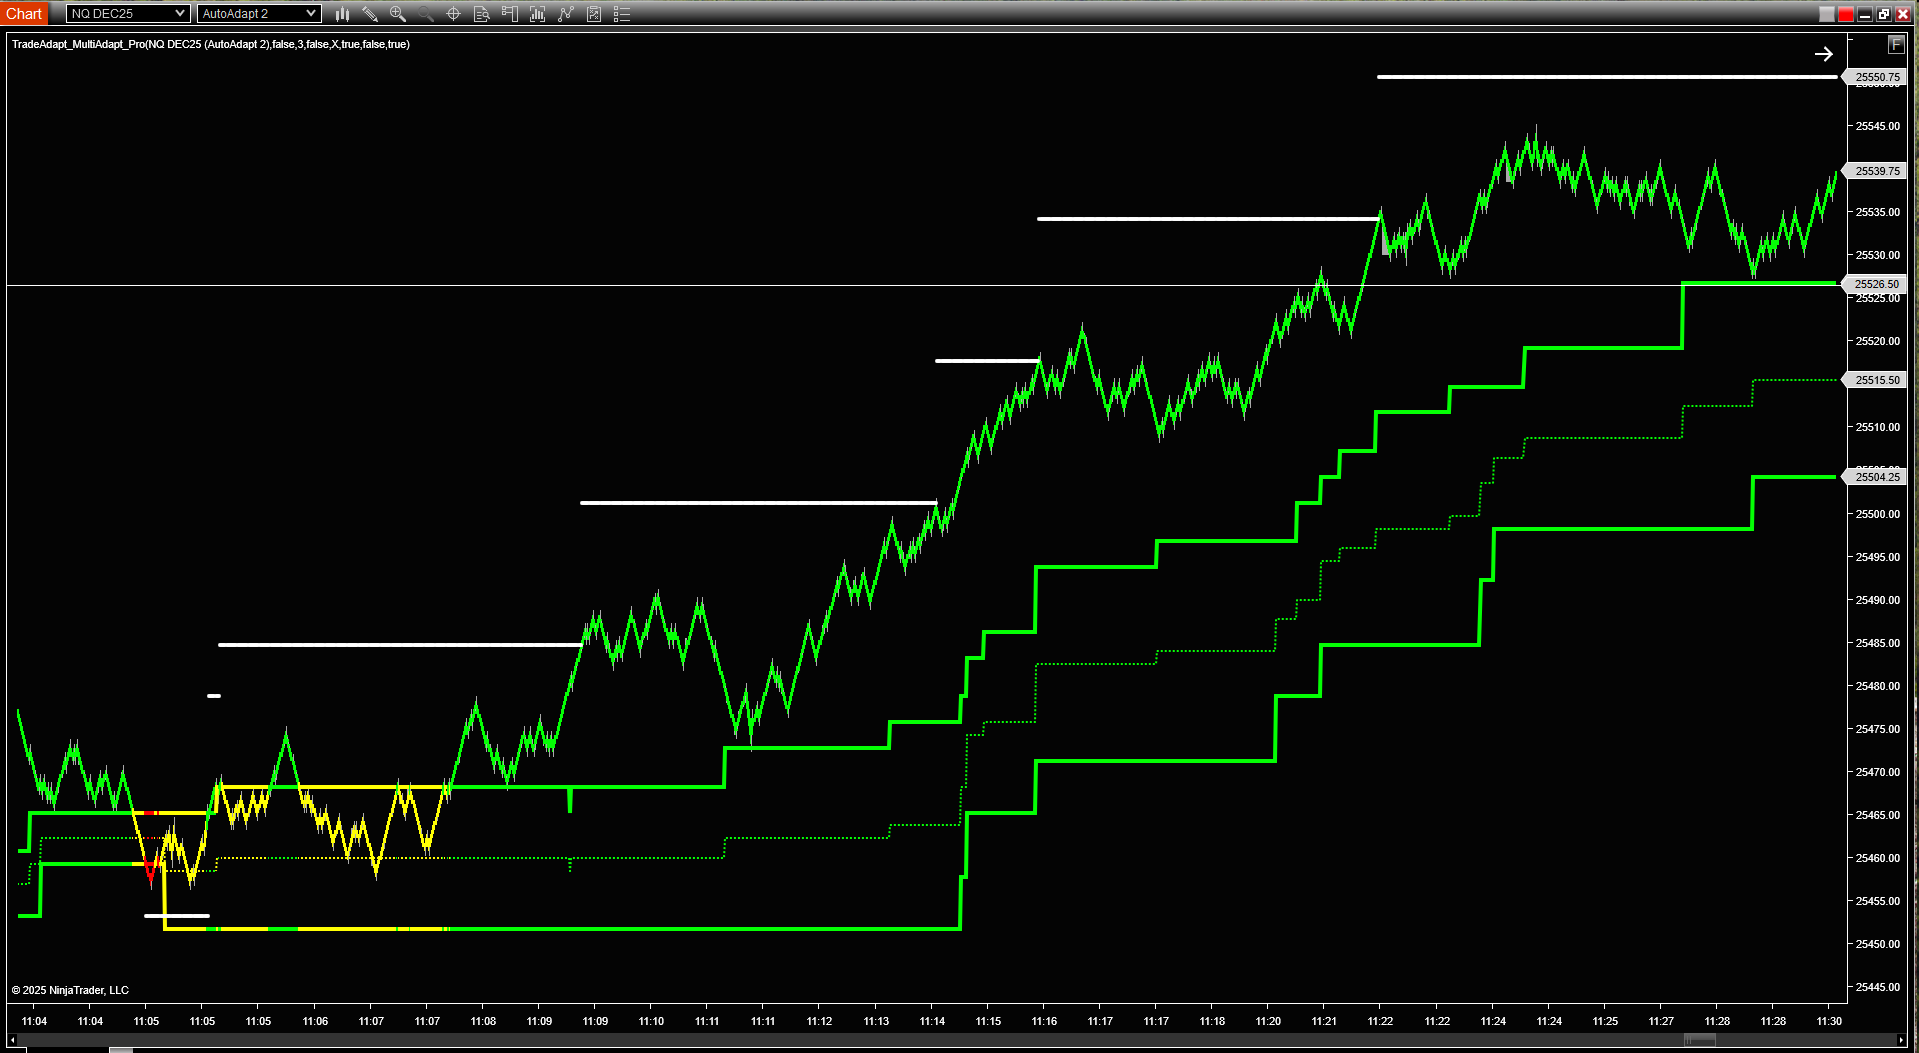
NinjaTrader Integration
Dashboard indicator plots all 8 timeframes with on-chart toggle buttons, KC channel lines, and volume bubbles natively rendered.
MetaTrader 5 Integration
MT5 indicator displays the same levels with MT5-native styling. Shown here: YM/US30 with multi-timeframe structure.
Web Dashboard
Access your levels from anywhere. No installation required.
Browser-Based Access
View your dashboard from any device with a browser. Desktop, tablet, or phone.
Real-Time Updates
Levels update automatically as new webhooks arrive. No refresh needed.
Market Filtering
Filter by market type, currency pair base, or timeframe alignment.
The TradingView Strategy
The engine that powers everything. Multi Adaptive FIB v2.2.
Four Timeframe Calculation
Monthly (1M), Weekly (1W), Daily (1D), and 4-Hour (240) levels calculated in real-time using ATR-based adaptive ranges.
Conditional Level Display
Levels cascade based on higher timeframe state. Above Monthly Buy? Weekly shows only Sell. Below Monthly Sell? Weekly shows only Buy. Between? Both show.
Webhook Integration
Built-in webhook alert sends complete JSON payload on every bar close. Market symbol, all levels, colors, states, targets — everything the dashboard needs.
Market Type Support
Configure for Futures, Currencies, Indexes, Stocks, or Crypto. Currency base field for forex pairs.

Start Your 7-Day Free Trial
Try Markets risk-free for 7 days. Cancel anytime, no charge.
Daily & weekly structure.
Every market.
/month
- ✓Multi-Adaptive FIB Dashboard
- ✓8 timeframes: Yearly → 15M
- ✓Web dashboard + desktop app
- ✓Chart indicators: NinjaTrader, MT5, cTrader, TradingView
- ✓All futures, forex, indices, crypto
- ✓Volume bubbles, KC channels, audio alerts
Cancel anytime
Intraday execution stack.
For NQ / ES / YM intraday traders.
/month
- ✓Everything in Markets
- ✓LTF + HTF intraday zones
- ✓StructureBars + Renko convergence
- ✓ORB + key levels overlays
- ✓OMS V3 order management
- ✓AI verdicts streamed to charts
Includes everything in Markets
Just want the audio narration? Get LiveAI free →
RISK DISCLOSURE & DISCLAIMER
PAST PERFORMANCE IS NOT INDICATIVE OF FUTURE RESULTS
The dashboard and system presented on this page are technical analysis tools. They do not predict future price movement, guarantee profitable trades, or eliminate trading risk. Market conditions vary and structure behaves differently in different environments.
TRADING INVOLVES SUBSTANTIAL RISK
Trading futures, forex, stocks, and other financial instruments involves substantial risk of loss and is not suitable for every investor. The high degree of leverage can work against you as well as for you. Before deciding to trade, you should carefully consider your investment objectives, level of experience, and risk appetite.
THE SYSTEM IS A TOOL, NOT INVESTMENT ADVICE
The Multi-Adaptive FIB system and dashboard are provided for informational and educational purposes only. They are not investment advice, nor are they recommendations to buy or sell any security or financial instrument. Users are solely responsible for their own trading decisions and should consult with a licensed financial advisor before making any investment decisions.
NO WARRANTY
The software and system are provided “as is” without warranty of any kind, either express or implied, including but not limited to warranties of merchantability, fitness for a particular purpose, or non-infringement. TradeAdapt.ai does not warrant that the system will be error-free, uninterrupted, or meet your requirements.
By using TradeAdapt Markets, you acknowledge that you have read, understood, and agree to this disclaimer and risk disclosure.
© 2026 TradeAdapt.ai · All Rights Reserved