Heikin Tracker: Signal
TradingView
The Most Advanced Multi-Timeframe Signal System for TradingView
- ✓ Multi-timeframe trend alignment across 6 configurable periods
- ✓ Volume-adapted signal generation with automatic thresholds
- ✓ Color-coded Buy/Sell zones for instant market direction
- ✓ Optional Execution Renko bands for precision timing
The Edge: Why Traders Choose Heikin Tracker: Signal
Most trading indicators show you the past. Heikin Tracker: Signal shows you multi-timeframe confluence - the single most powerful edge in directional trading.
When 6 different timeframes align in the same direction with volume confirmation, you're not guessing - you're trading with institutional-level probability on your side. This is our most sophisticated TradingView system, combining Heikin Ashi trend analysis with real-time volume adaptation and optional Renko execution levels.
Timing: Why It Matters
Different chart timeframes trigger at different moments. Understanding this creates opportunity.
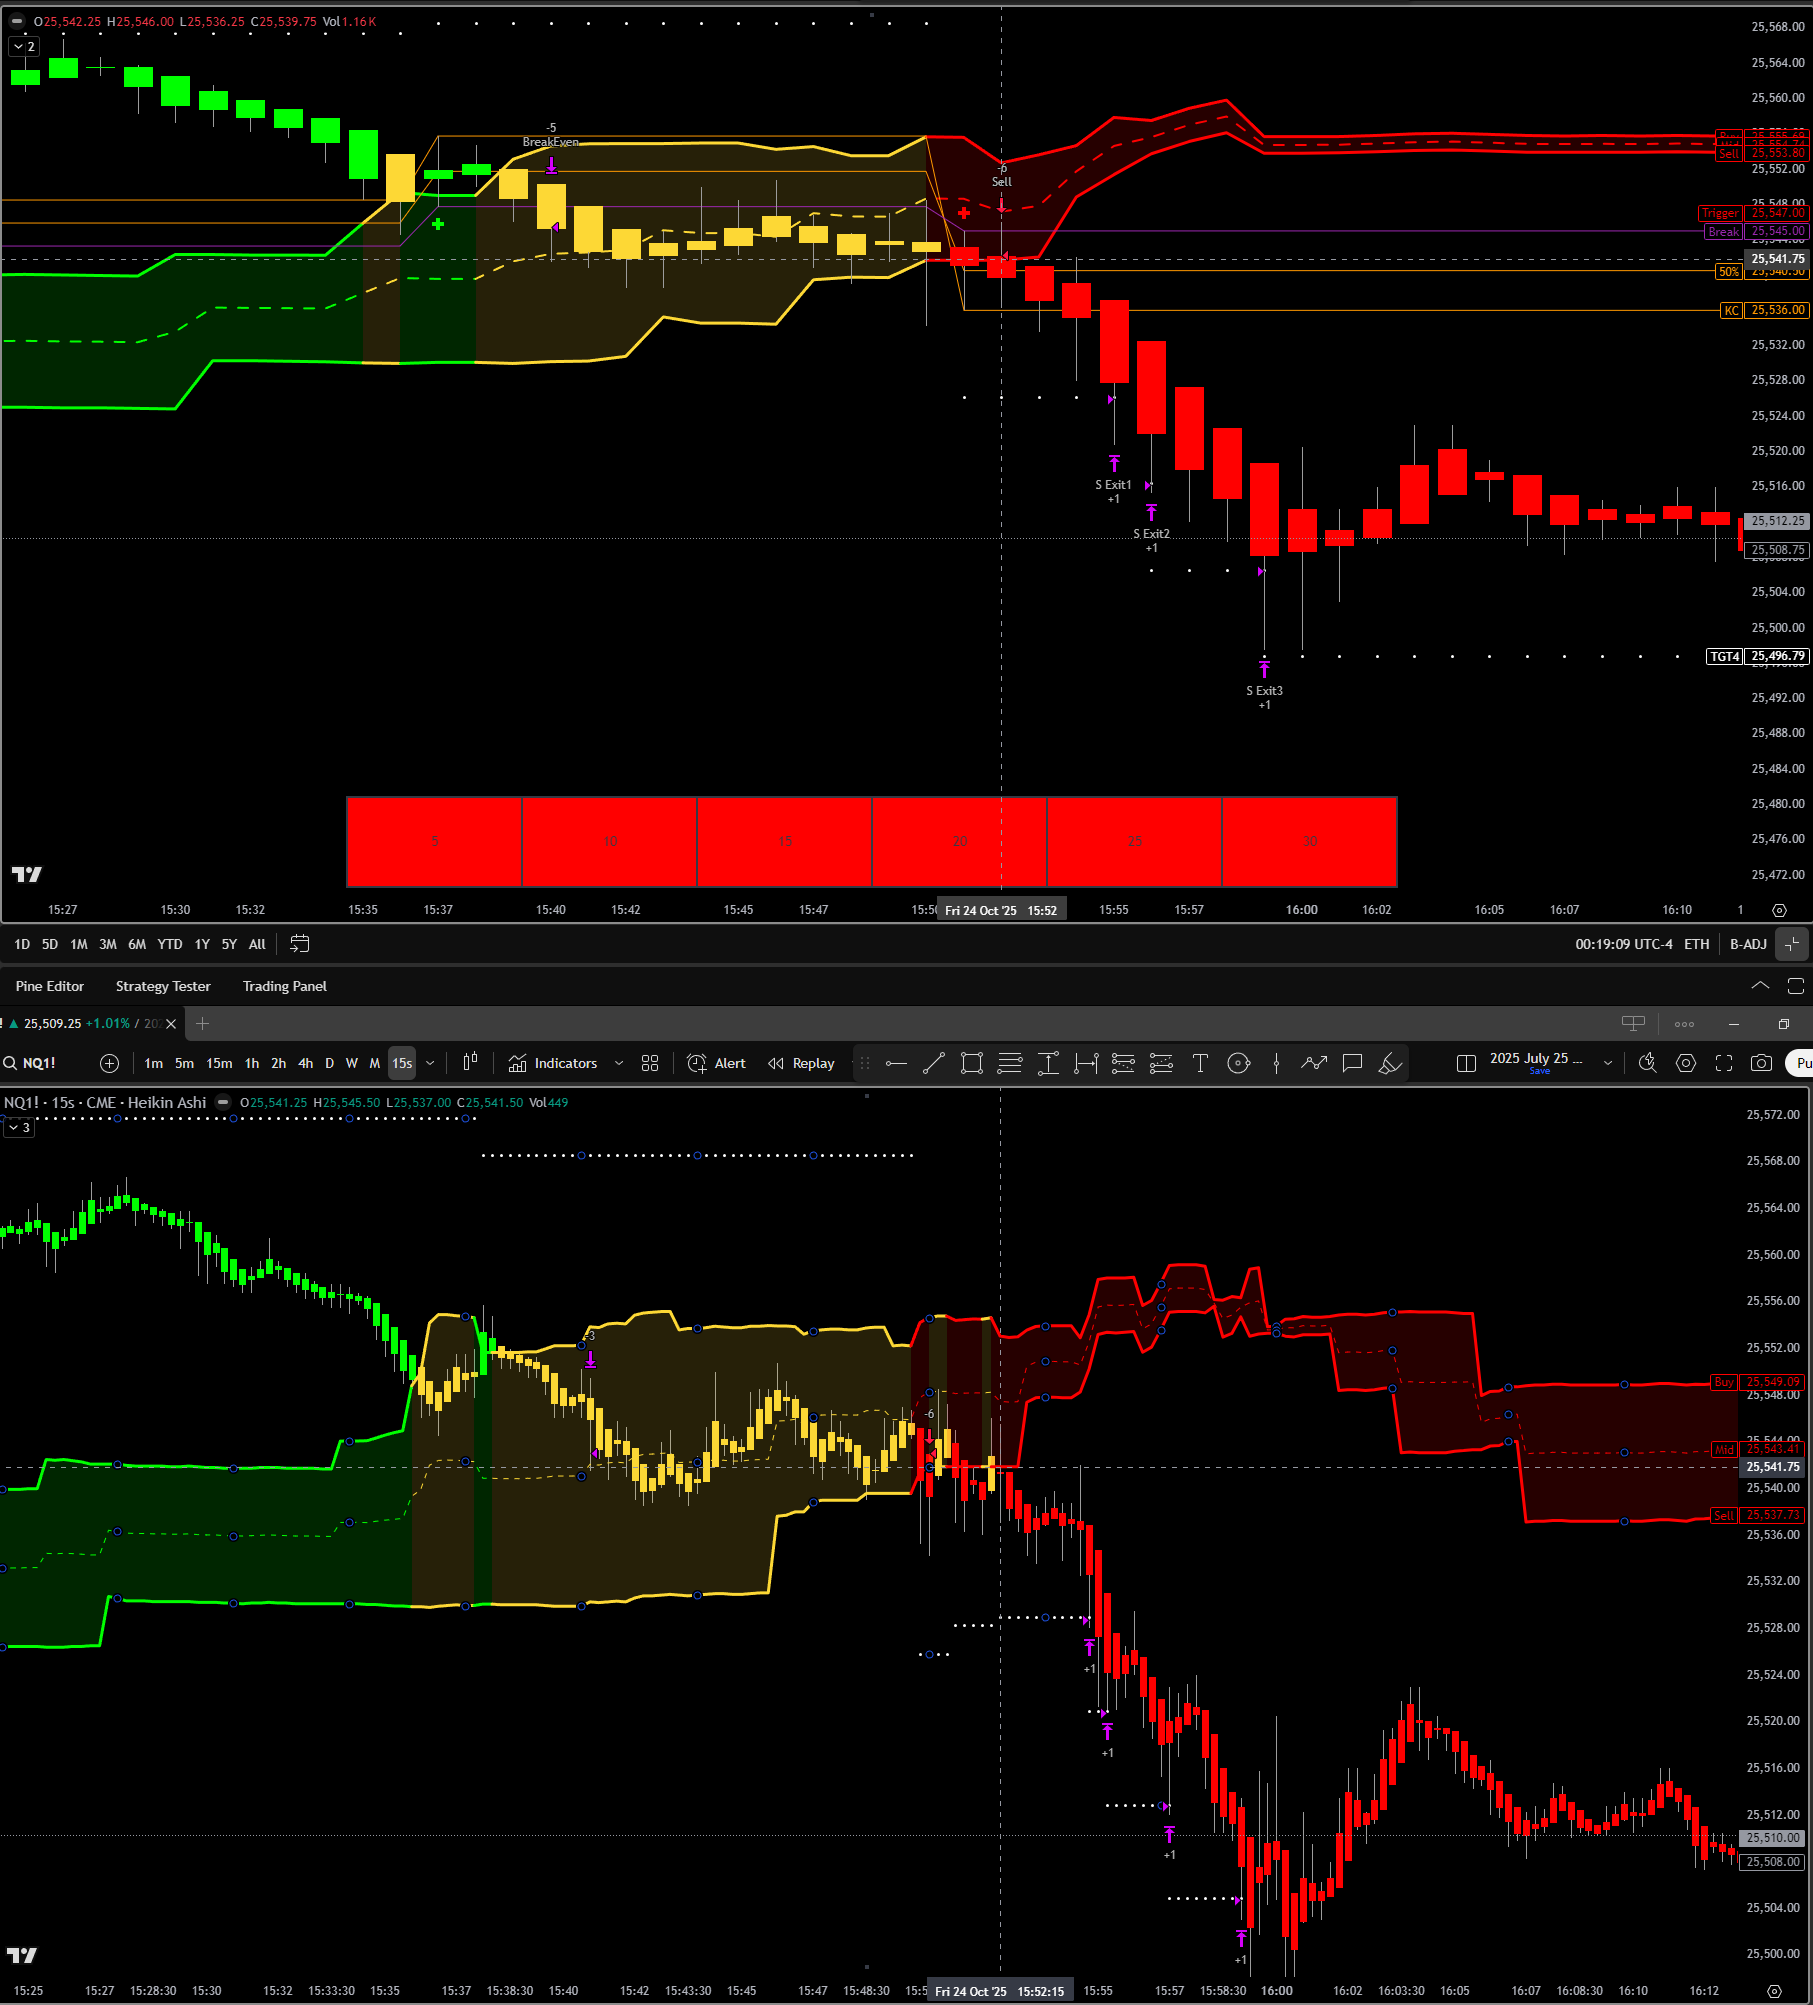
Same system, same data - dramatically different timing (click to enlarge)
This chart shows the same market with the same system tracking the same data points (5, 10, 15, 20, 25, and 30 minute periods):
- Top Chart (1-Minute Heikin Ashi): Signal triggered when the 1-minute bar closed and confirmed the setup.
- Bottom Chart (15-Second): Signal triggered almost 2 full minutes earlier - before the 1-minute bar even closed.
The Algorithmic Reality
Automated trading systems control when orders hit exchanges. Systems running on 1-minute bars send orders every minute. Systems on 15-second bars send orders every 15 seconds. This creates a cascade effect where fast timeframes trigger first, moving price. Medium timeframes trigger next, adding momentum. Slow timeframes trigger last, confirming the move.
The 15-second chart gave you nearly 2 minutes of lead time. In fast-moving markets, that's the difference between getting filled at the signal level versus chasing price after the move already started.
Your Edge: When you see all 6 timeframes align on Heikin Tracker: Signal, you're witnessing institutional-level confluence. The color-coded dashboard instantly shows you market direction across multiple periods. By choosing a faster chart timeframe (like 15-second), you can act on this confluence before slower timeframe traders even see the signal.
Core Features
Multi-Timeframe Tracking
Monitor 6 configurable timeframes simultaneously. Watch short-term scalping periods (5min, 10min, 15min) align with longer swing periods (20min, 25min, 30min) for powerful confluence signals.
Volume Adaptation
Automatically adjusts signal generation based on volume patterns. The system calculates dynamic thresholds using rolling volume averages with configurable multipliers.
Heikin Ashi Analysis
Enhanced Heikin Ashi calculations across all tracked timeframes filter market noise and identify true trend direction using proprietary oxNext calculations.
Visual Dashboard
Color-coded table display shows all 6 timeframe states at a glance. Green = bullish, Red = bearish, instantly revealing market alignment and confluence opportunities.
Buy/Sell Zone Detection
Automatically calculates and displays consolidated Buy and Sell zones by sorting and aggregating signals from all tracked timeframes. Mid-point calculations show equilibrium.
Optional Renko Bands
Integrate ExecutionRenko library for precision entry timing. Renko bands provide additional execution reference points based on price momentum and structure.
Performance Data
All charts below show the same system, tracking the same levels and timeframes, on the same data series (ES Futures), over the last 90 days. The only difference is the chart timeframe, which dramatically affects trade frequency and fill quality.
5-Minute Chart: 2,099 Trades
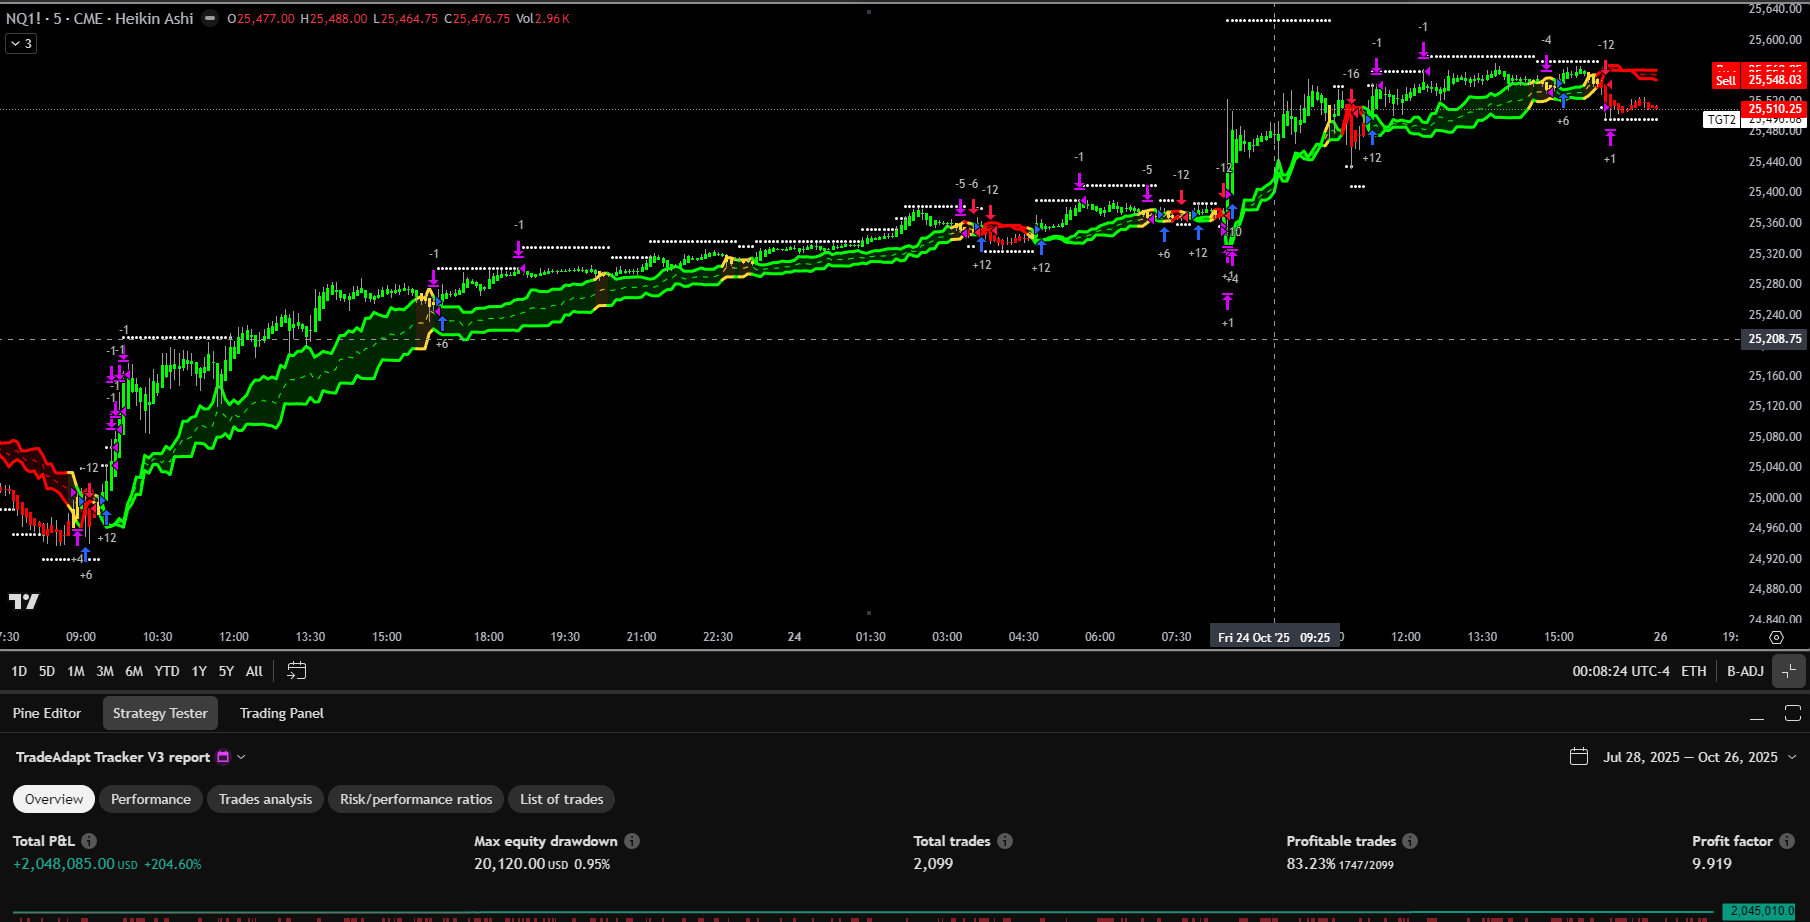
Balanced trade frequency with good fill quality
1-Minute Chart: 3,917 Trades
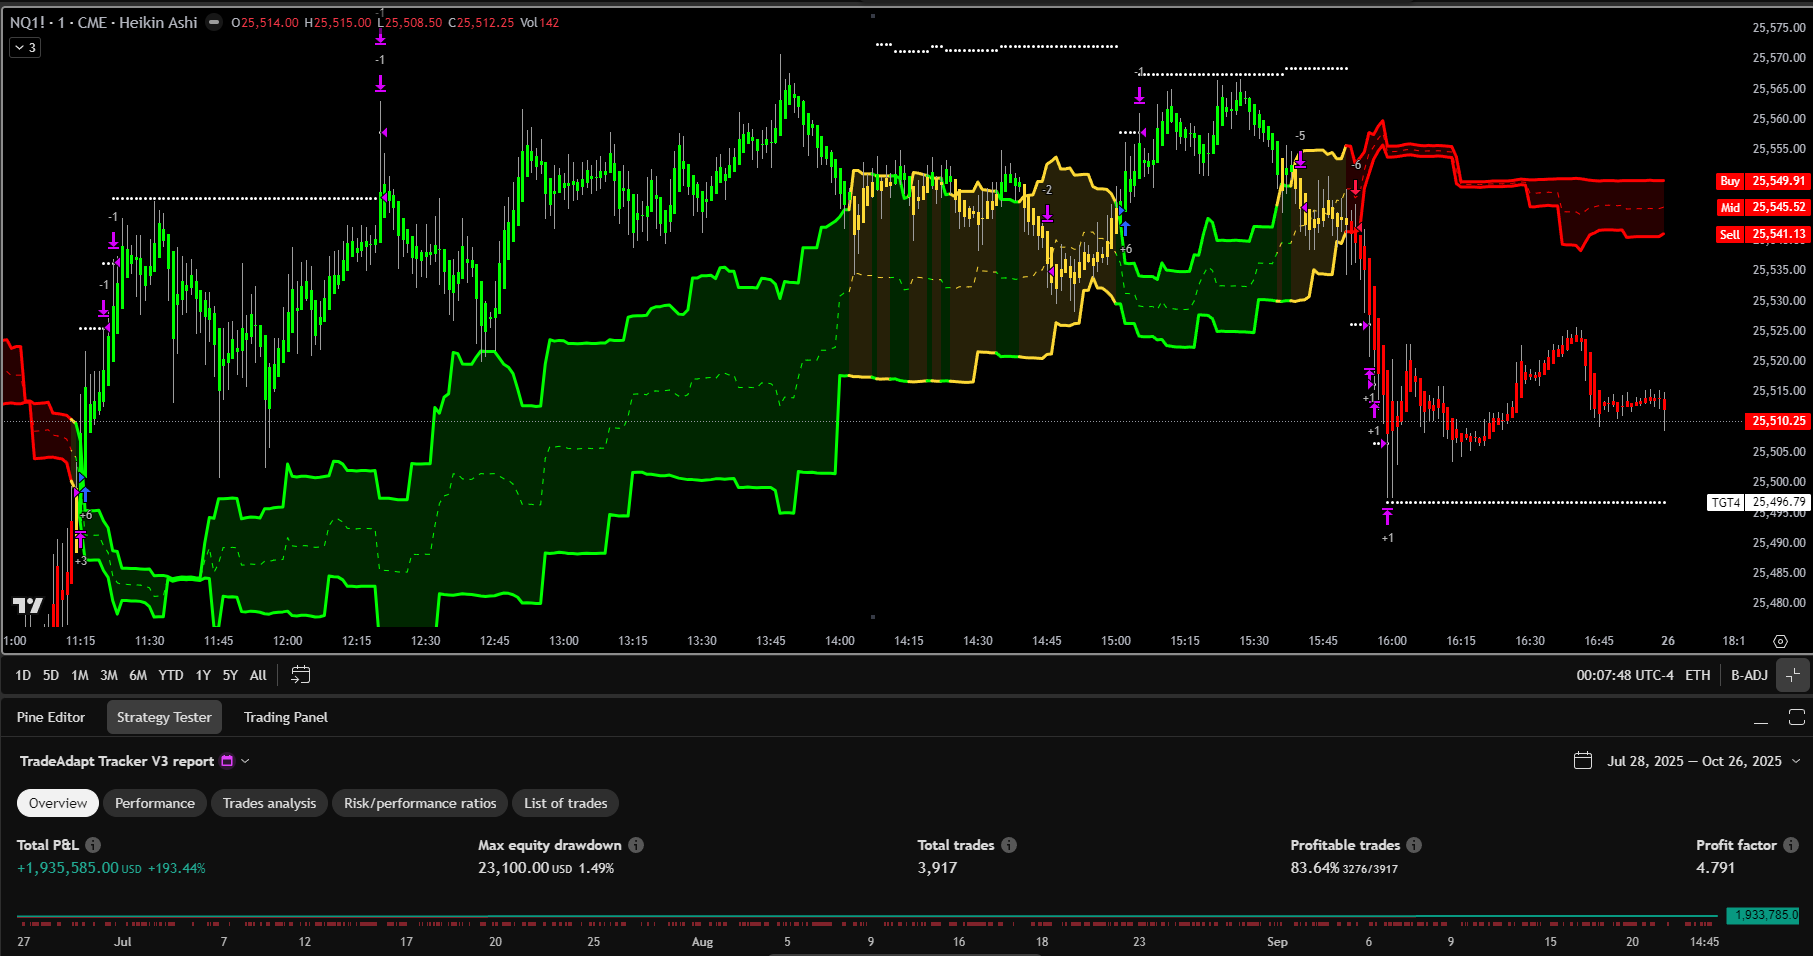
Higher trade frequency - more opportunities, more management
Key Insight: Shorter chart timeframes generate more signals but require more active management. Longer timeframes produce fewer, higher-quality setups. Choose your chart timeframe based on your trading style and availability. The signal system itself remains consistent across all timeframes.
What You Get
- Complete TradingView indicator with full source code access
- Integrated strategy for backtesting and automated trading
- ExecutionRenko library integration for precision timing
- Setup and configuration guide with recommended timeframe combinations
- Strategy examples and best practices documentation
- Access to TradeAdapt community and ongoing updates
- Compatible with all TradingView instruments (Futures, Forex, Crypto, Stocks)
- Works on all chart timeframes from seconds to monthly
Perfect For
- Trend Traders - Identify when multiple timeframes align for high-probability trend entries and ride momentum waves
- Swing Traders - Use longer timeframes (1H-Daily) to catch major moves with confluence confirmation across 6 periods
- Day Traders - Track intraday timeframes (1min-30min) for precise entry timing on aligned signals with volume confirmation
- Scalpers - Monitor ultra-short periods (15sec-5min) for quick entries when fast timeframes cascade
- Multi-Asset Traders - Works equally well on Futures, Forex, Crypto, and Stocks with identical signal logic
- Systematic Traders - Backtest strategies using built-in position management and scaling exit logic
Complete System: Add Heikin Tracker: Execute
Heikin Tracker: Signal identifies where the opportunity is and when timeframes align. Heikin Tracker: Execute determines precisely when to enter at real market prices using HeikinAlgoBars technology. Together they form a complete signal-to-execution system that bridges the gap between Heikin Ashi analysis and actual trading.
Pro Tip: Run Signal on a separate panel below your chart, then overlay Execute on the price chart for the ultimate multi-timeframe confluence + execution timing combination.
Configuration Examples
Scalping Setup (Chart Timeframe: 1-minute)
- Length 1: 1 min - Length 2: 2 min - Length 3: 3 min
- Length 4: 5 min - Length 5: 8 min - Length 6: 10 min
- Fast reaction to intraday micro-trends
Day Trading Setup (Chart Timeframe: 5-minute)
- Length 1: 5 min - Length 2: 10 min - Length 3: 15 min
- Length 4: 20 min - Length 5: 25 min - Length 6: 30 min
- Default configuration shown in product images
Swing Trading Setup (Chart Timeframe: 1-hour)
- Length 1: 1H - Length 2: 2H - Length 3: 4H
- Length 4: 6H - Length 5: 8H - Length 6: 12H
- Captures major intraday and multi-day trends
Customization: All 6 timeframes are fully configurable inputs. Experiment with different combinations to match your trading style and the instruments you trade. The visual dashboard adapts automatically to any timeframe selection.
Configuration Reference
Quick reference for all available settings.
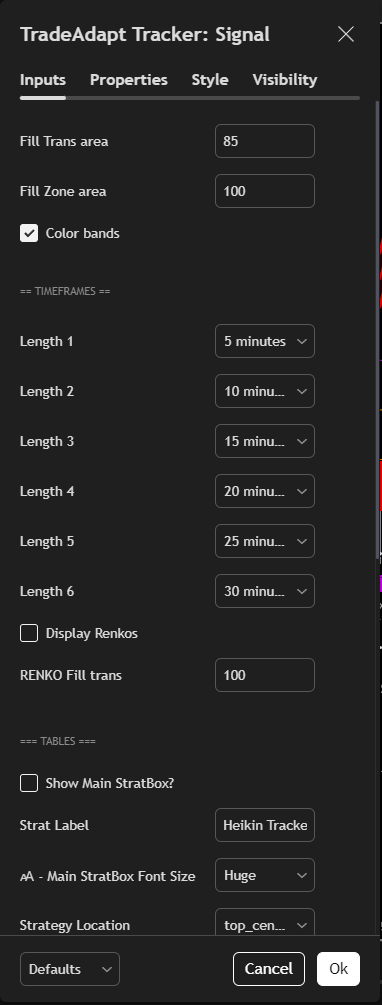
Timeframe and display settings (click to enlarge)
Essential Settings
Fill Trans area: 90 (default)
Transparency of the main signal zone fills (0-100). Lower = more visible. Higher = more subtle. Adjust for personal preference.
Fill Zone area: 75 (default)
Transparency of the consolidated Buy/Sell zones. Keep moderate (70-80) for visibility without obscuring price action.
Color bands: Enabled (default)
Toggle to enable/disable color-coding of timeframes. Green = bullish, Red = bearish. Disable for monochrome display.
Volume multiplier: 1.5 (default)
Threshold for volume-based signal adaptation. Increase to 2.0 for more selective signals, decrease to 1.0 for more sensitive response.
Length 1-6: 5, 10, 15, 20, 25, 30 minutes (default)
Your 6 configurable timeframes for multi-period tracking. Fully customizable to match your trading style - from seconds to days.
Display Renkos: Enabled (default)
Shows ExecutionRenko bands for precision entry timing. Disable if using Signal without Execute for cleaner display.
RENKO Fill trans: 80 (default)
Transparency of the Renko bands. Keep high (75-85) to see Renko zones without obscuring signals.
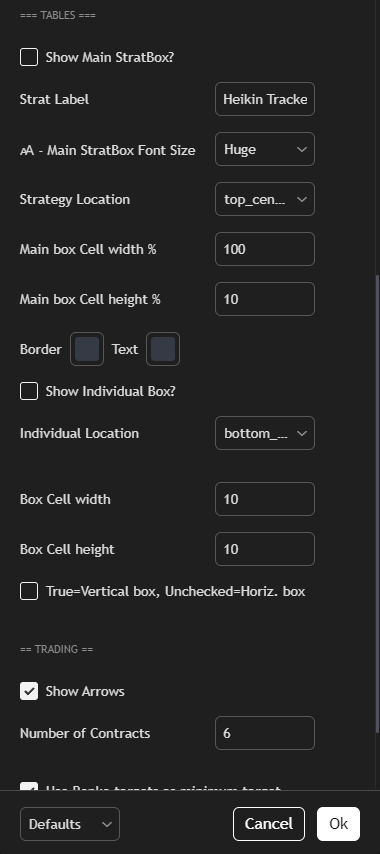
Table and strategy settings (click to enlarge)
Dashboard Controls
Show Box: Enabled (default)
Toggles the timeframe status table on/off. The table shows all 6 timeframes with color-coded status indicators.
Horizontal or Vertical: Horizontal (default)
Choose table orientation. Horizontal = 6 columns × 1 row. Vertical = 1 column × 6 rows. Select based on chart layout.
Position: Middle (default)
Place dashboard at top, middle, or bottom of chart. Middle works for most layouts without blocking price action.
Width/Height: Auto (default)
Adjust table cell dimensions for visibility. Increase if timeframe labels are truncated, decrease for compact display.
Strategy Settings
These settings affect the built-in TradingView strategy for backtesting purposes. The core signal generation (Buy/Sell zones and timeframe alignment) works independently of strategy settings.
Show Arrows: Enabled (default)
Display entry signal arrows on chart. Useful for backtesting visualization. Disable for cleaner signal-only display.
Number of Contracts: 6 (default)
Position size for strategy backtesting. The system scales out one contract at each of the 6 target levels.
Use Renko targets: Enabled (default)
Whether to incorporate Renko range in target calculations. Creates more dynamic targets based on current market structure.
Join the Waitlist
We're onboarding 10 new traders per week with personalized setup and strategy consultation.
Starting at $200/month
Multiple billing options available • 30-day money-back guarantee
Current wait time: 3-5 days • You'll receive personal onboarding call
Complete TradingView Bundle
Get All 4 Premium Systems + Free ORB Indicator
Heikin Tracker: Signal • Heikin Tracker: Execute • Execution Renko • Adaptive FIB • Multi-Range ORB (Free)
Annual: $9,840/year (Save 20% = $820/month)
RISK DISCLOSURE & DISCLAIMER
TRADING INVOLVES SUBSTANTIAL RISK OF LOSS
Trading futures, forex, stocks, and other financial instruments involves substantial risk of loss and is not suitable for every investor. The high degree of leverage can work against you as well as for you. You should carefully consider whether trading is suitable for you in light of your circumstances, knowledge, and financial resources.
You may lose all or more of your initial investment. Do not invest money that you cannot afford to lose. Opinions, market data, and recommendations are subject to change at any time. Past performance is not indicative of future results.
NO GUARANTEE OF RESULTS
TradeAdapt provides educational tools and indicators. We do not guarantee profits or protection from losses. Trading results vary based on many factors including market conditions, execution quality, strategy implementation, and individual risk management. Screenshots and examples are for educational purposes only and do not represent typical results.
HEIKIN ASHI EXECUTION CONSIDERATIONS
The backtested results shown utilize Heikin Ashi candlesticks with 'fill_orders_on_standard_ohlc' enabled, which provides smoothed price action and averaged values. This creates more favorable backtest fills than standard execution in live markets. Live trading results will differ from backtested results due to execution timing, slippage, market impact, and the difference between Heikin Ashi calculations and actual market prices.
NOT FINANCIAL ADVICE
TradeAdapt indicators and educational content do not constitute financial, investment, or trading advice. All decisions to trade are your own. You should consult with a licensed financial advisor before making any investment decisions. The indicators provided are tools for analysis - how you use them is entirely your responsibility.
SOFTWARE PROVIDED "AS IS"
TradeAdapt indicators are provided "as is" without warranty of any kind. We do not guarantee error-free operation, compatibility with all platforms, or uninterrupted service. While we strive for accuracy, indicators may contain bugs or calculation errors. You are responsible for testing and validating any indicator before risking real capital.
By purchasing and using TradeAdapt products, you acknowledge that you have read, understood, and agree to this disclaimer and assume all risks associated with trading financial instruments.