TradeAdapt
KEY LEVELS
- 1H, 2H, 4H, Daily Levels
- Monday Range Tracking
- Customizable Display Options
- Auto-Updating Lines
What Key Levels Does
Key Levels plots horizontal reference lines showing the High, Low, and Midpoint from multiple timeframes on your chart. Simple, clean lines that show you where important levels sit across different time horizons.
The Purpose
Markets respect prior highs, lows, and midpoints. Key Levels makes these reference points immediately visible without cluttering your chart. You see where today’s action relates to yesterday’s range, this hour relates to last hour, and so on.
Available Timeframes
1-Hour Levels
Shows the High, Low, and Mid from the previous 1-hour period. Updates each hour with the new reference levels.
2-Hour Levels
Shows the High, Low, and Mid from the previous 2-hour period. Updates every 2 hours.
4-Hour Levels
Shows the High, Low, and Mid from the previous 4-hour period. Updates every 4 hours.
Daily Levels
Shows the High, Low, and Mid from the previous trading day. Updates at the start of each new session.
Monday Range
Plots Monday’s High, Low, and Mid throughout the week. Many traders watch how the week’s price action relates to Monday’s opening range.
Display Options
Show/Hide Individual Levels
Each timeframe has three toggle options:
- Show High: Display the high line
- Show Low: Display the low line
- Show Mid: Display the midpoint line
Mix and match to show only what matters to your strategy. Want just the daily high and low? Enable those and disable everything else.
Color and Width Settings
Each timeframe has customizable color and line width settings. Make dailies bold and obvious, keep hourly levels subtle. Your chart, your choice.
Label Display
Enable labels to see text descriptions on each line (1H-High, Daily-Low, etc.). Choose whether labels appear to the left or right of the lines. Adjust text size and position to fit your chart layout.
How It Updates
Real-Time Recalculation
Key Levels recalculates every 5 minutes to keep lines current without excessive processing. When a new period begins (new hour, new day, etc.), the indicator automatically updates to show the latest reference levels.
Line Drawing Options
Two modes for how lines are drawn:
Standard Mode: Lines draw back a fixed number of bars (default: 100 bars). Good for most chart types.
Actual Timeframe Mode: Lines draw from when the period actually occurred. Shows exactly when each level was established. Useful for understanding timing relationships.
Practical Use
Support and Resistance
Prior highs and lows act as natural support and resistance. When price approaches a Key Level line, watch for reactions – bounces, breaks, or consolidations often occur at these levels.
Range Context
The distance between high and low lines shows you the size of the prior period’s range. Tight ranges suggest consolidation or low volatility. Wide ranges show expansion or trending action.
Midpoint Trading
Many traders use midpoints as pivot references. Price above the mid suggests bullish context, below suggests bearish. Some strategies enter near the mid with stops at the high or low.
Monday Range Watching
The Monday range often sets the tone for the week. Breakouts beyond Monday’s high or low can signal directional moves. Price staying within Monday’s range might suggest consolidation.
Configuration Settings
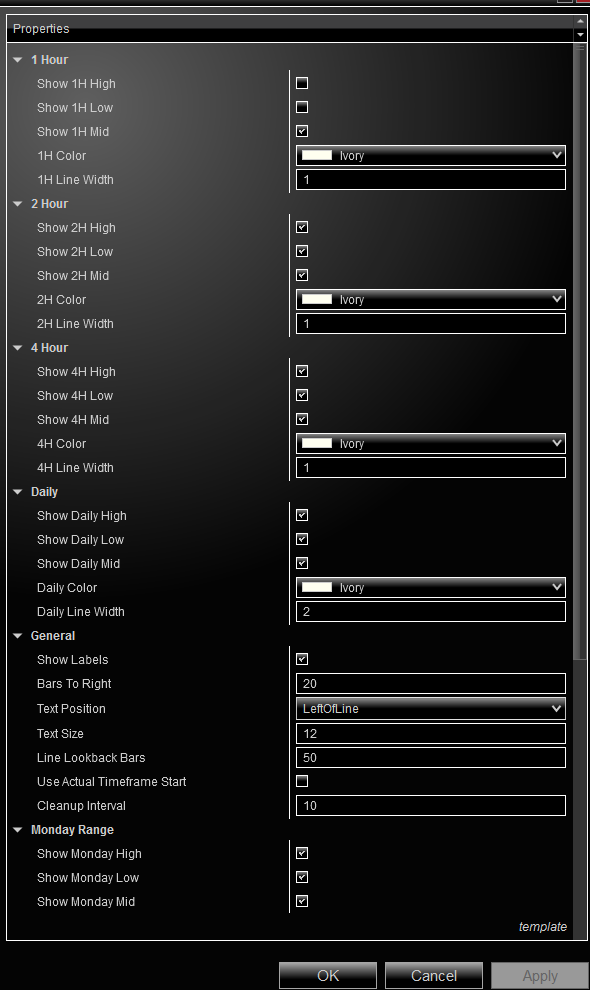
Configuration panel showing all available settings (click to enlarge)
General Settings
- Show Labels: Toggle text labels on/off
- Text Position: Place labels right or left of lines
- Text Size: Adjust label font size (8-20)
- Bars To Right: Control label offset distance
- Line Lookback Bars: How far back lines extend (10-500)
- Use Actual Timeframe Start: Draw lines from period occurrence
- Cleanup Interval: Refresh drawings every X bars
Per-Timeframe Settings
Each timeframe (1H, 2H, 4H, Daily, Monday) has identical controls:
- Show High (checkbox)
- Show Low (checkbox)
- Show Mid (checkbox)
- Color (color picker)
- Line Width (1-5)
Setup Recommendations
For Intraday Scalpers
Focus on 1H and 2H levels. Enable labels for quick reference. Use bright colors so levels stand out on fast-moving charts.
For Day Traders
Display Daily levels prominently (thicker lines), with 4H levels as secondary reference. Consider adding Monday range for weekly context.
For Swing Traders
Daily and Monday levels are most relevant. Disable hourly timeframes to keep charts clean. Extend line lookback to see longer history.
Clean Chart Setup
Show only midpoint lines (disable highs and lows). This gives you key reference levels without visual clutter. Add highs/lows back if you need exact boundaries.
Support & Resources
Visit TradeAdapt.ai for installation guides, video tutorials, and community discussion.