TradeAdapt
MULTIADAPT PRO
- Four Timeframes, One Chart
- Automatic Reversal Detection
- Dynamic Price Targets
- SuperDOM Integration Available
What MultiAdapt Pro Does
MultiAdapt Pro plots adaptive bar levels from four different timeframes simultaneously on your chart. Think of it as having four traders watching different timeframes, all reporting to you at once.
The Multi-Timeframe Edge
Markets move on multiple timeframes simultaneously. What looks like a reversal on a 5-minute chart might just be noise on a 15-minute chart. MultiAdapt Pro shows you the structure across four timeframes, letting you see when levels align – or when they diverge.
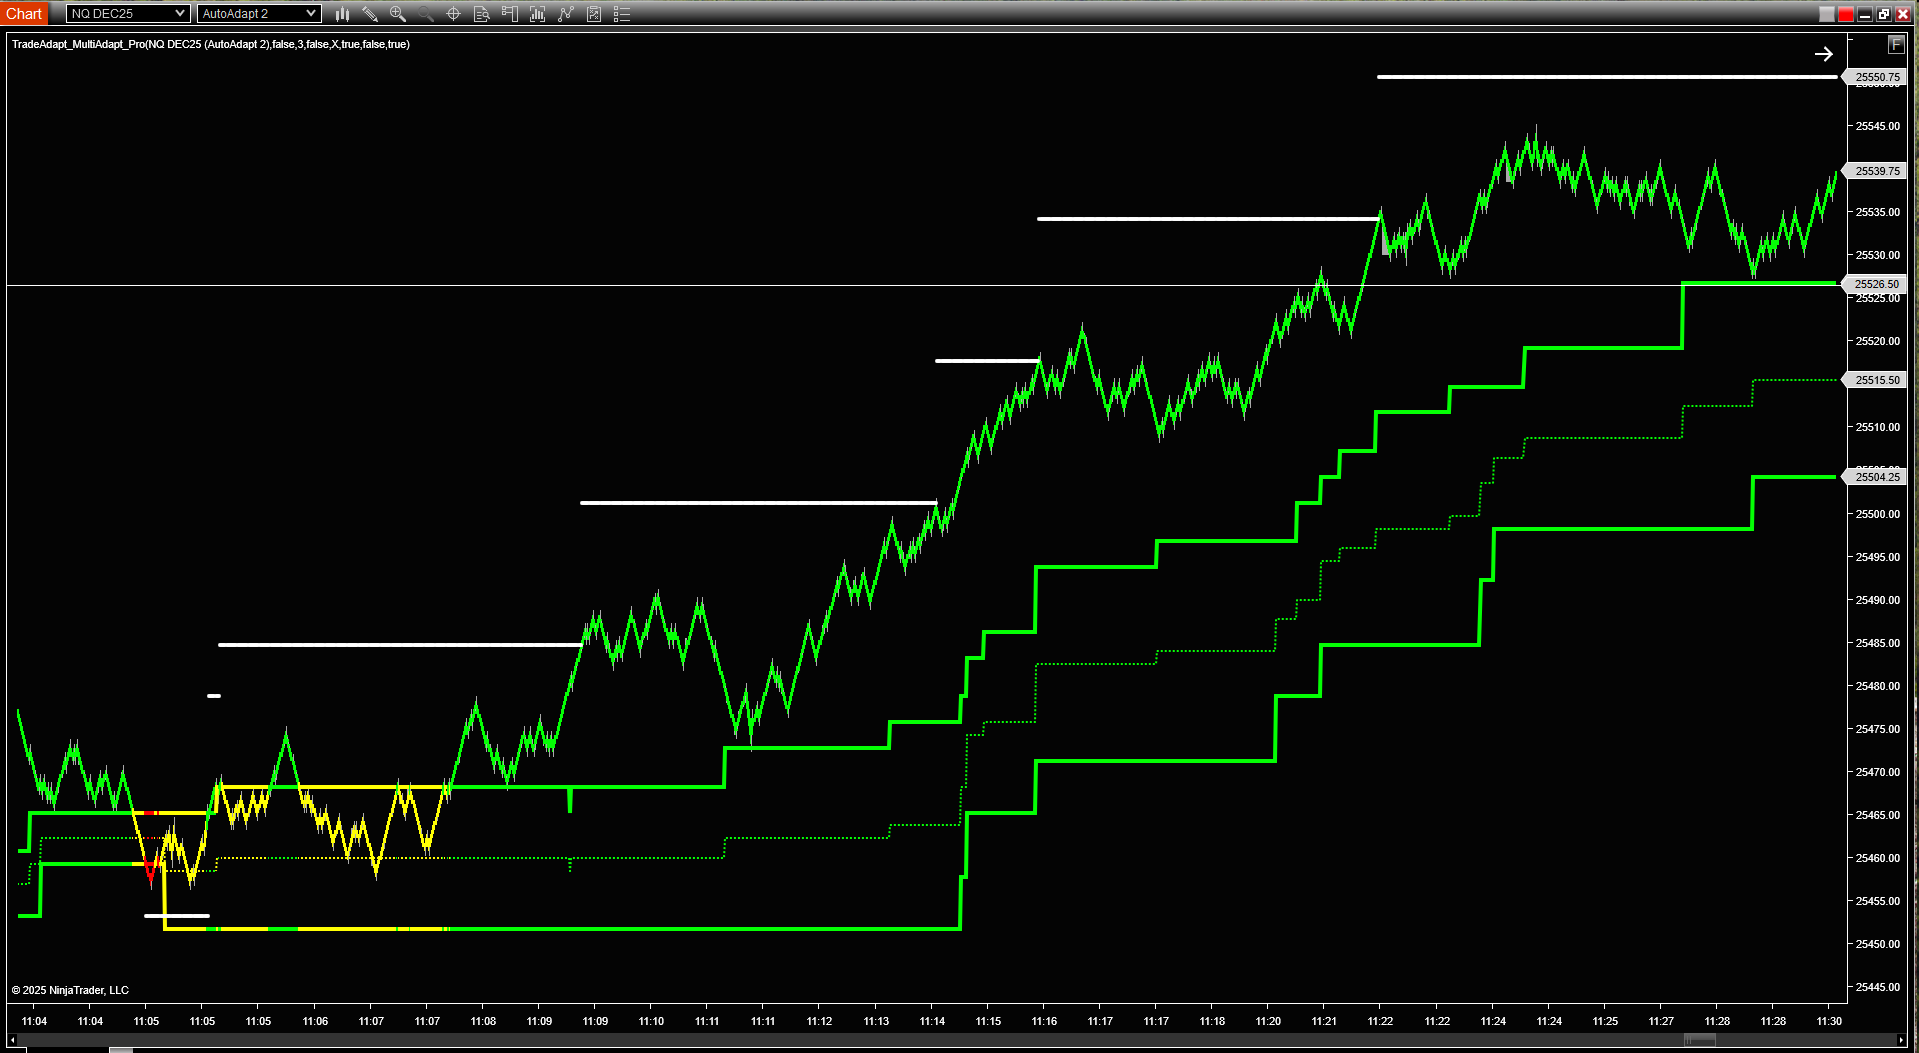
NQ chart showing Buy/Sell levels, Midpoint, and progressive targets (click to enlarge)
Display Options
Show Mid Only
When enabled, displays only the midpoint between buy and sell levels for each timeframe. This declutters your chart while still showing you where each timeframe’s structure sits.
The midpoint calculation: (Buy Level + Sell Level) ÷ 2
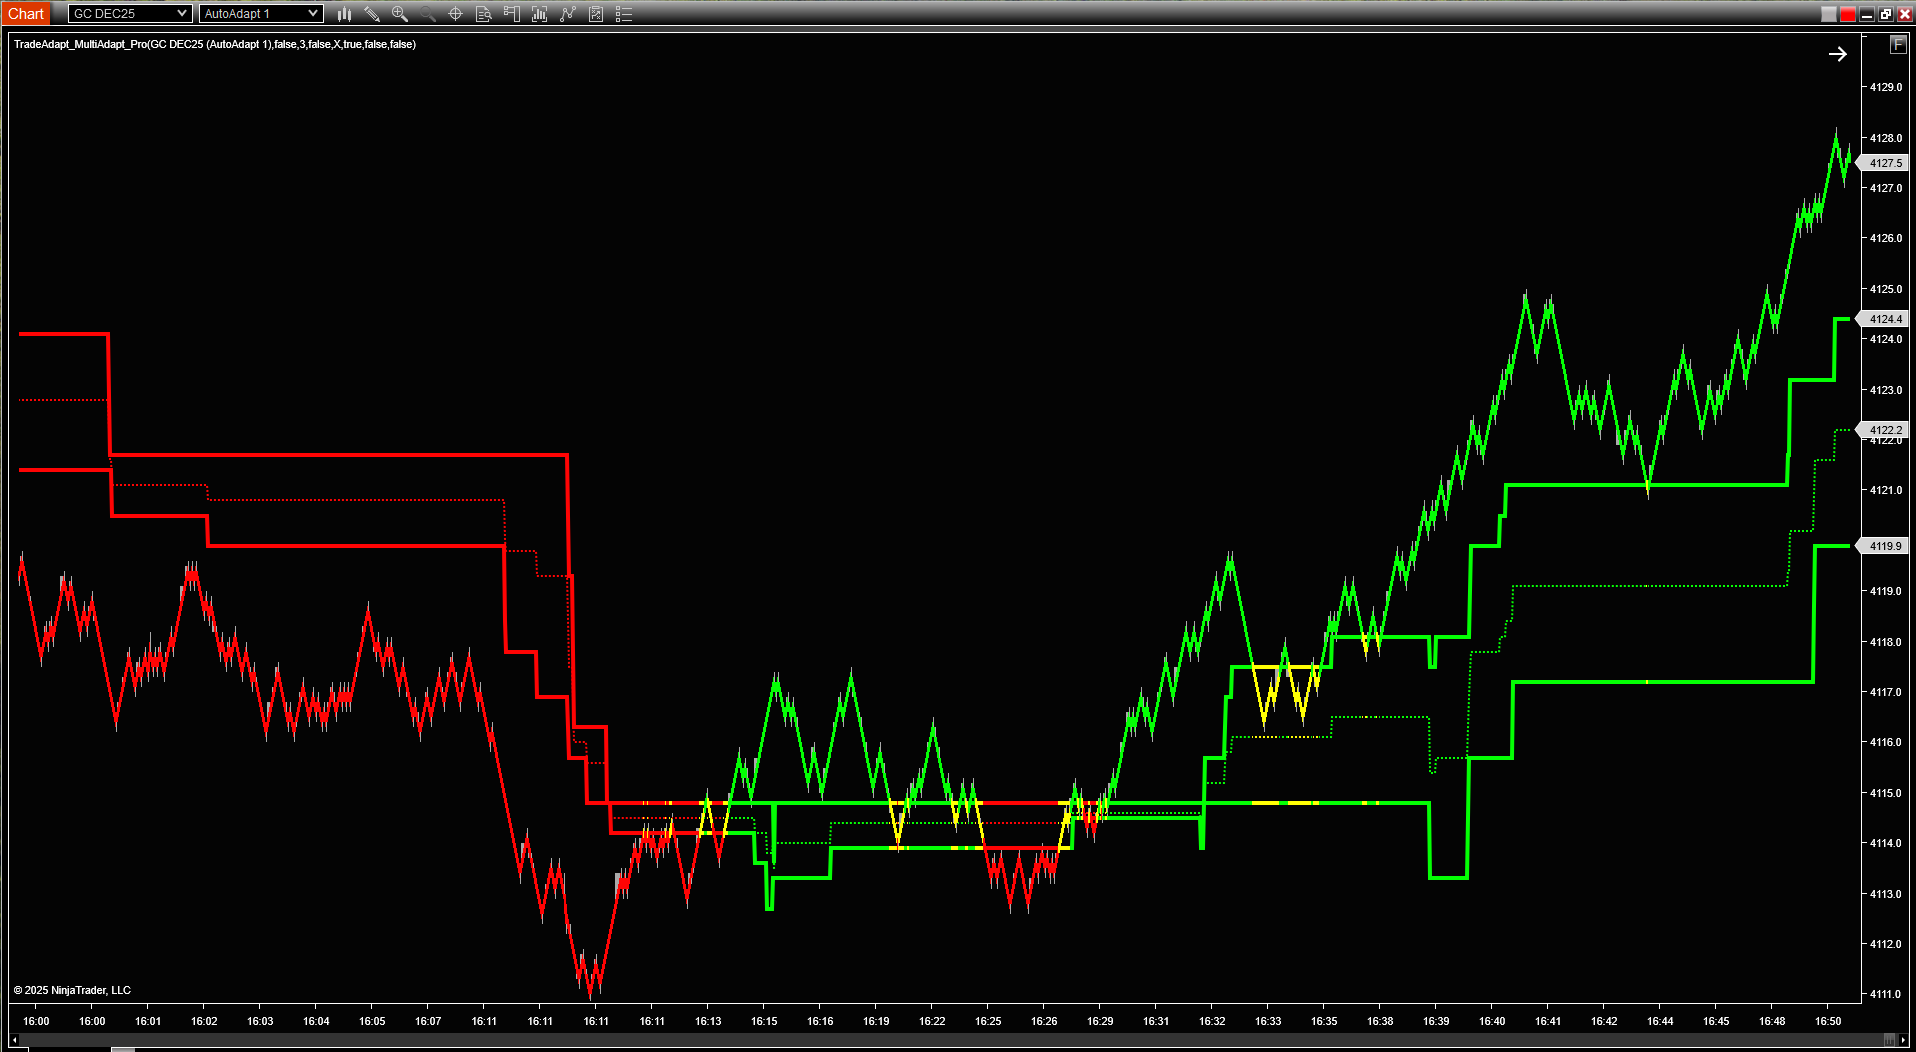
GC chart with Buy (green), Sell (red), and Mid (dotted) levels displayed (click to enlarge)
Show Reversals
Plots reversal points when AdaptBar structure changes direction. These mark where the underlying adaptive bars detected a trend change on each timeframe.
Paint Bars
Colors price bars based on their position relative to the mid level:
- Green bars: Close above mid level
- Red bars: Close below mid level
Target System
MultiAdapt Pro includes an automated target system that projects potential price objectives based on the longest timeframe’s structure:
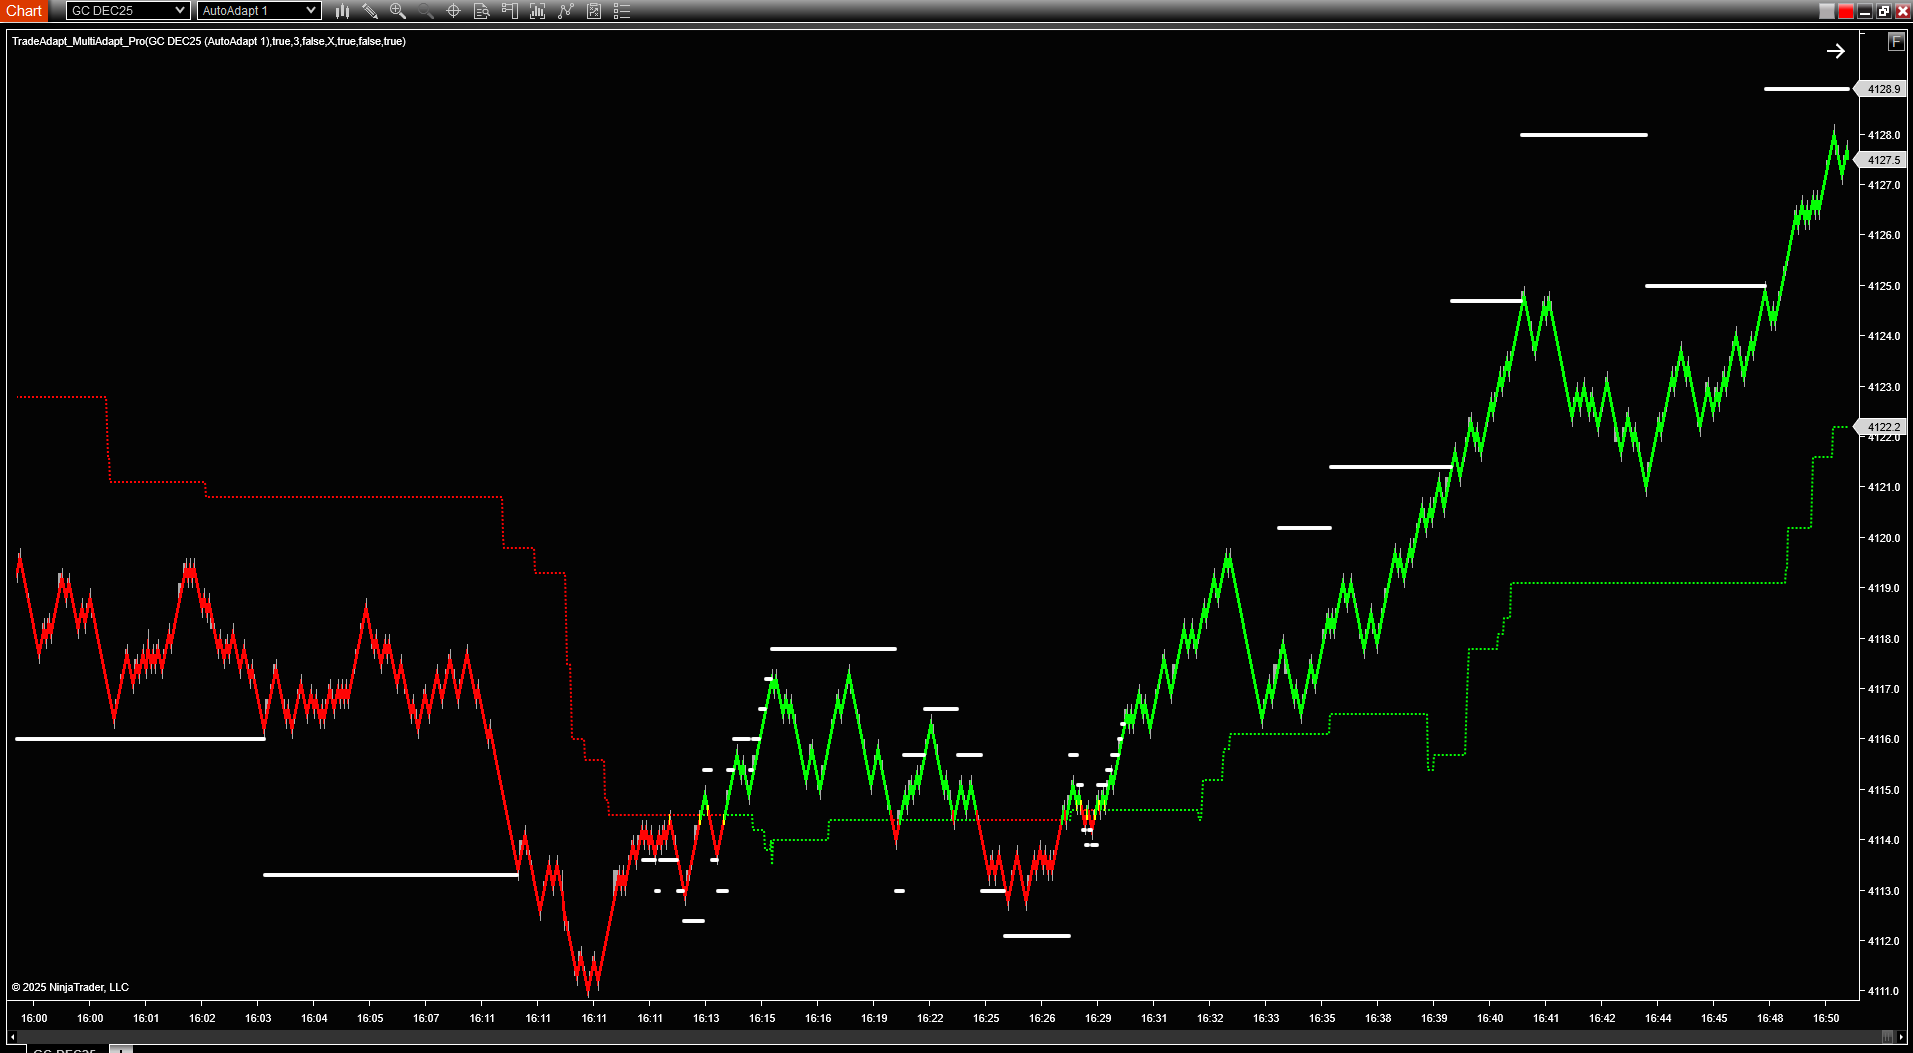
GC chart in “Mid Only” mode with progressive target levels displayed (click to enlarge)
- TGT1: Nearest target (from 10x timeframe)
- TGT2: Second target
- TGT3: Third target
- TGT4: Fourth target
- TGT5: Extended target
Targets appear as white lines on your chart when a directional signal is active. They disappear when the market is flat (no clear directional structure).
Using Targets Effectively
Targets are calculated from the largest timeframe’s levels and represent potential zones of interest. They’re not guaranteed profit targets – they’re structural levels where the market may pause, reverse, or accelerate.
Data Output Feature
MultiAdapt Pro can output level data to text files for use by other tools and strategies:
Output Settings
- Output MultiAdapt Data: Enable/disable file writing
- Output Label: Custom label for your files (default: “X”)
Files are written to: Documents/NinjaTrader 8/MultiAdaptData/
File format: [Instrument]_[Label]_[ChartSize].txt
Each file contains: Buy level, Sell level, Target level (comma-separated)
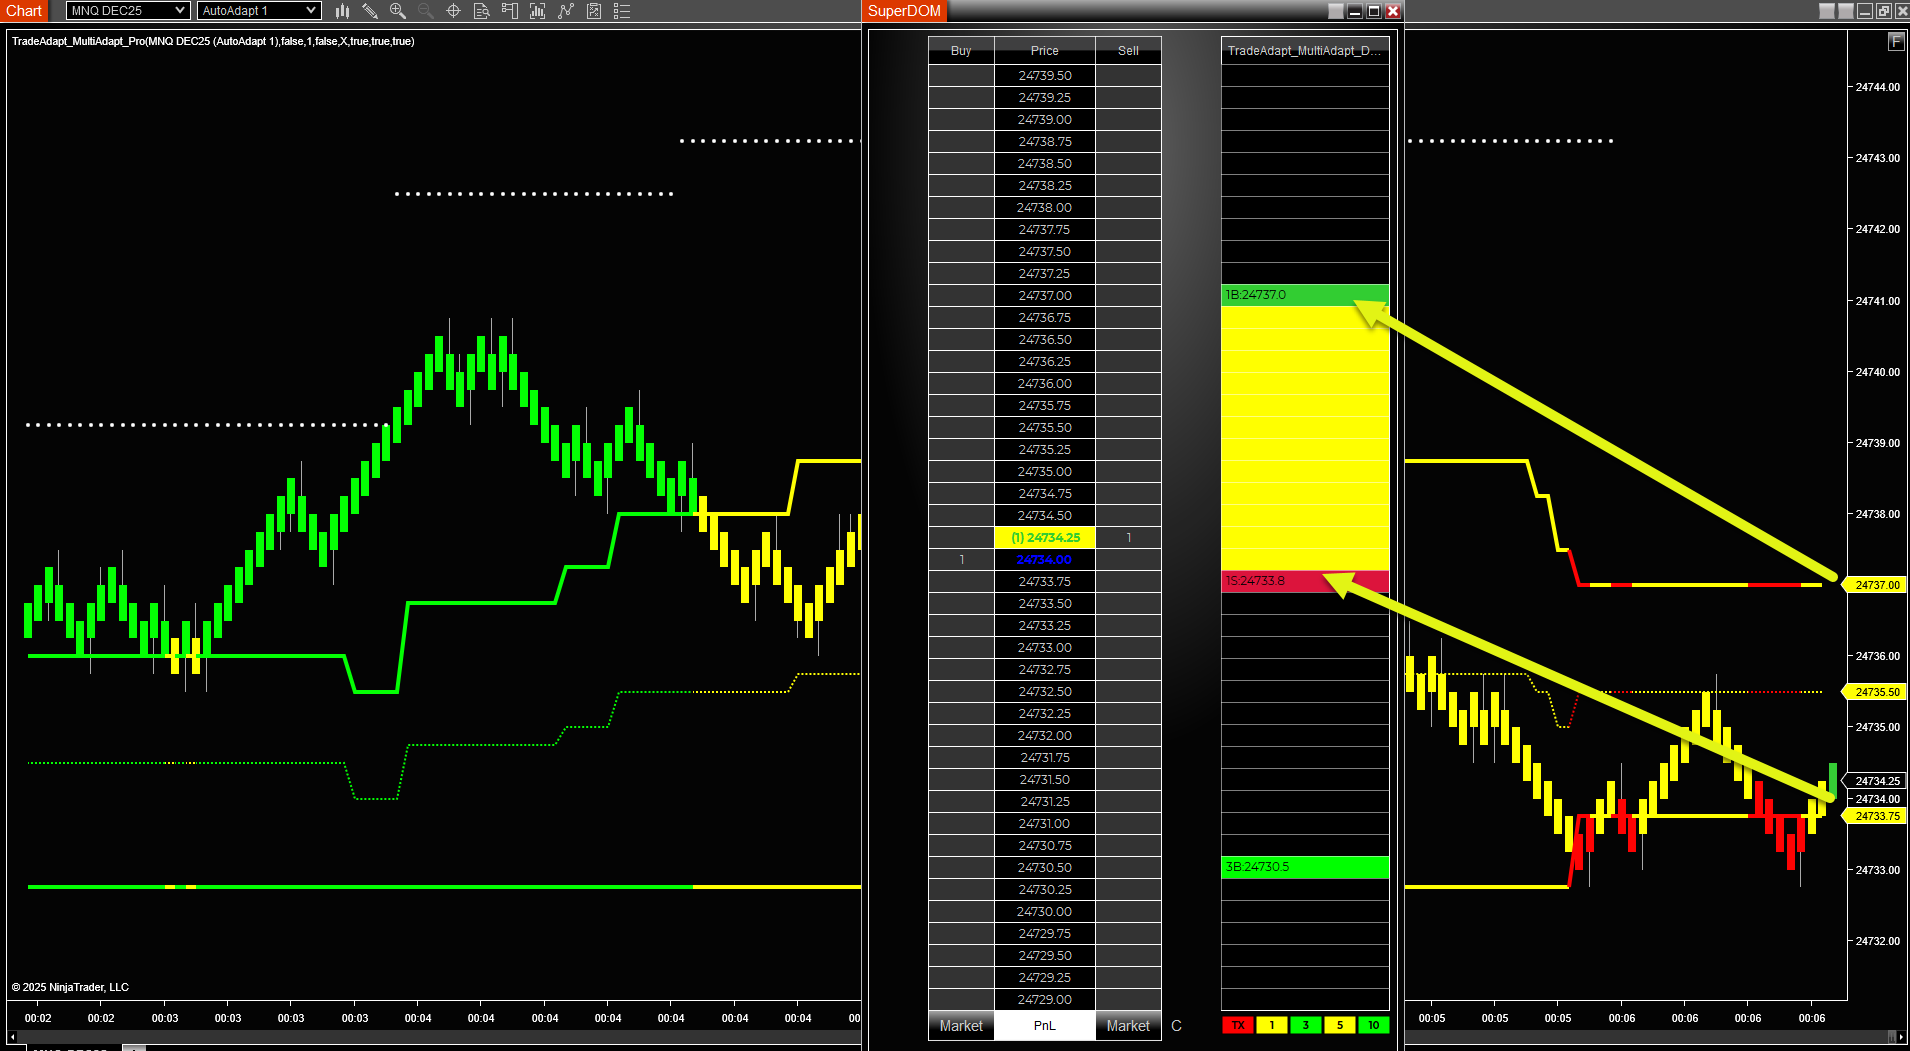
MultiAdapt DOM: SuperDOM Integration
The MultiAdapt DOM column brings your multi-timeframe levels directly into the NinjaTrader SuperDOM, giving you instant visual feedback on where you are relative to structure.
What the DOM Column Shows
The DOM column reads the data files created by MultiAdapt Pro and displays color-coded levels at the appropriate prices in your SuperDOM:
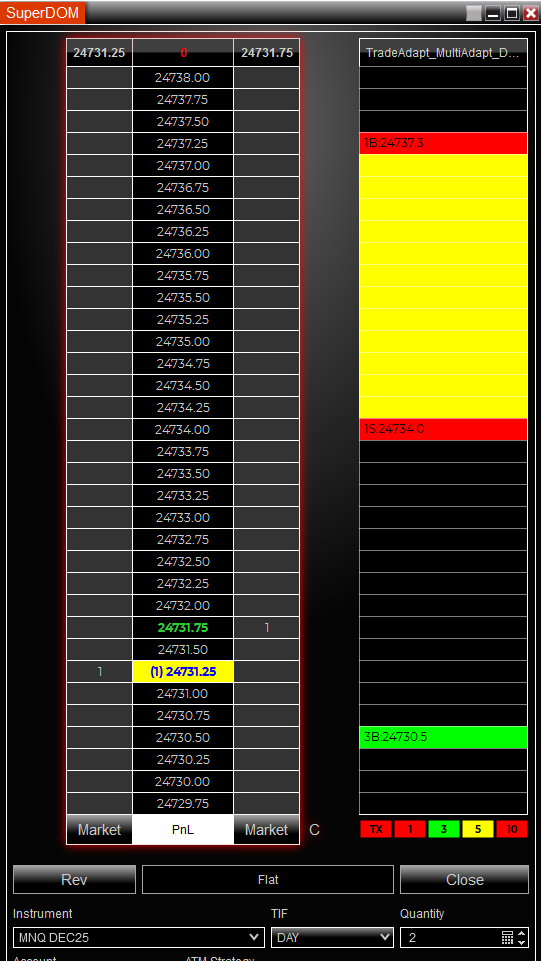
MultiAdapt levels displayed directly in SuperDOM columns (click to enlarge)
- Green levels: Price is above the buy level (bullish zone)
- Red levels: Price is below the sell level (bearish zone)
- Yellow levels: Price is between buy and sell (neutral zone)
Display Modes
Buy/Sell Lines Mode: Shows all buy and sell levels from your configured timeframes. This gives you the complete picture but can be visually dense.
Mid Only Mode: Shows only the midpoint of each timeframe. Cleaner display, perfect for quick reference.
Combo Mode: Dynamically switches between showing all levels or just mids based on current market structure. The DOM reads additional market data to determine which display is most relevant.
DOM overlay showing multi-timeframe levels (click to enlarge)
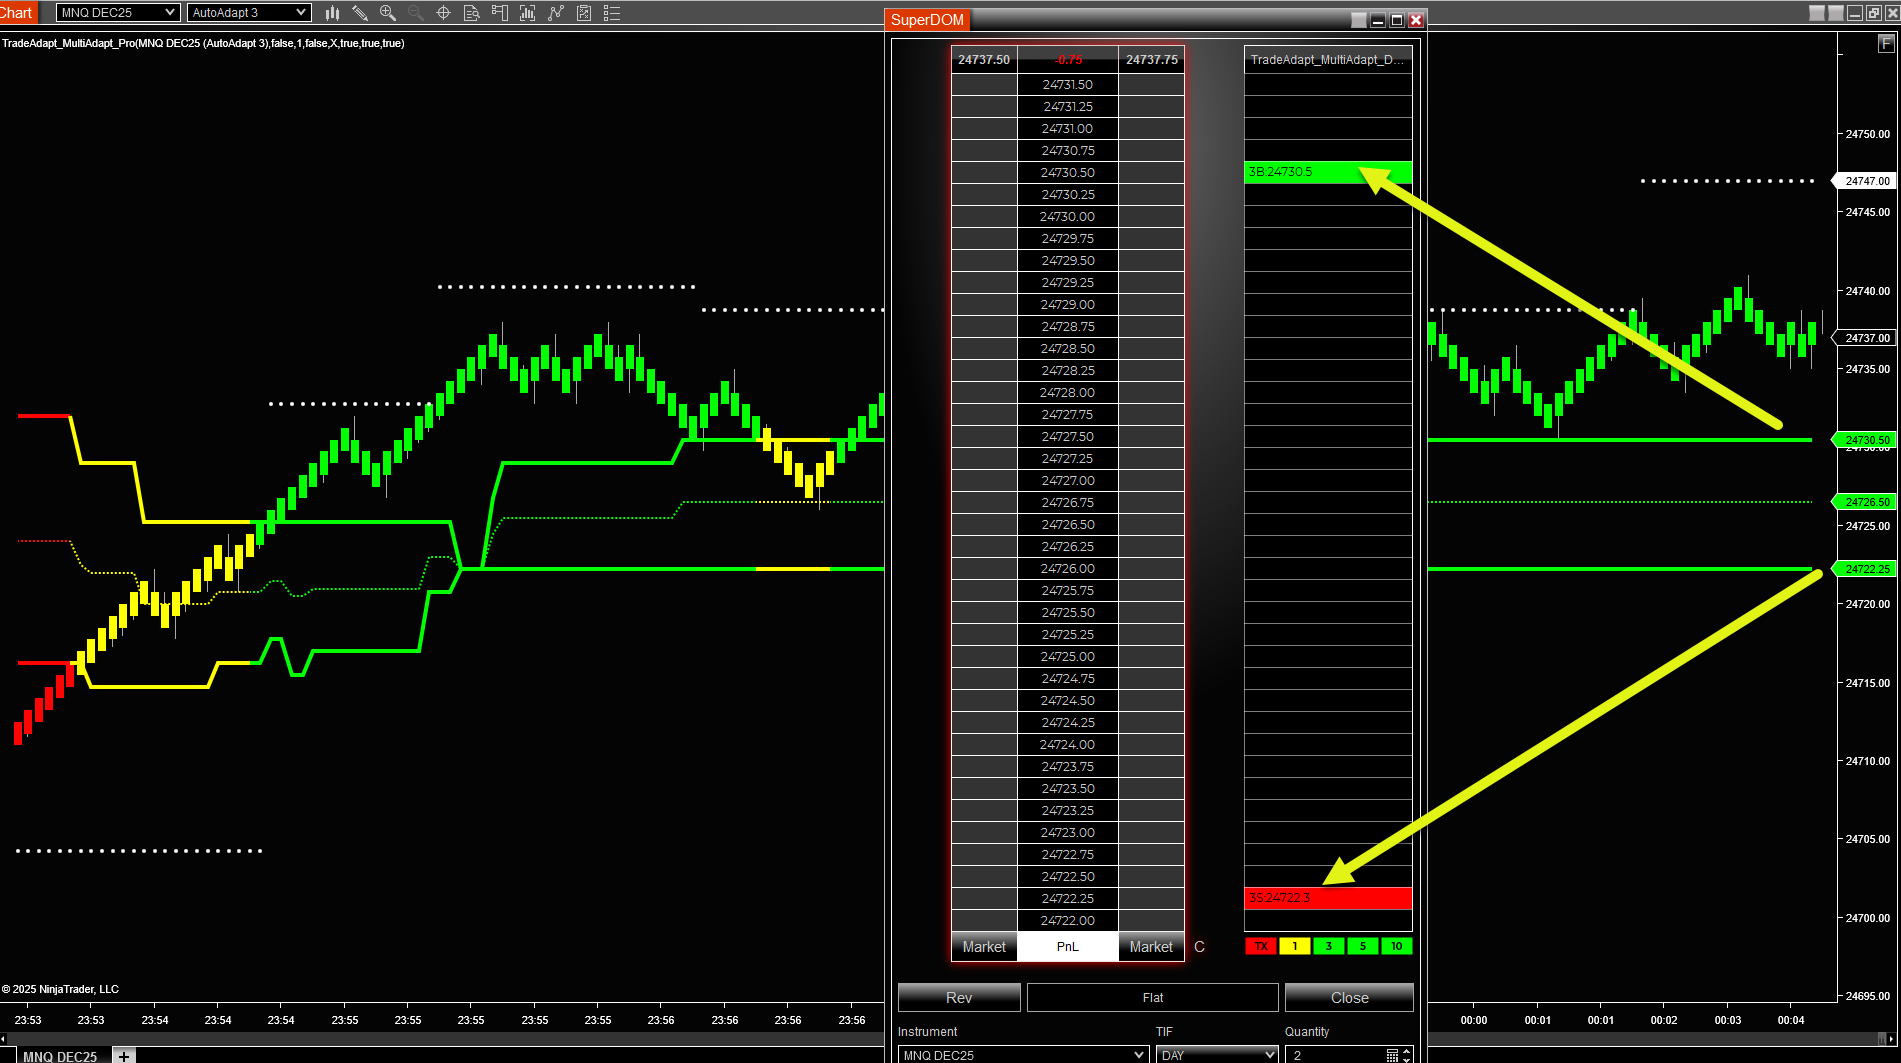
DOM overlay with alternate configuration (click to enlarge)
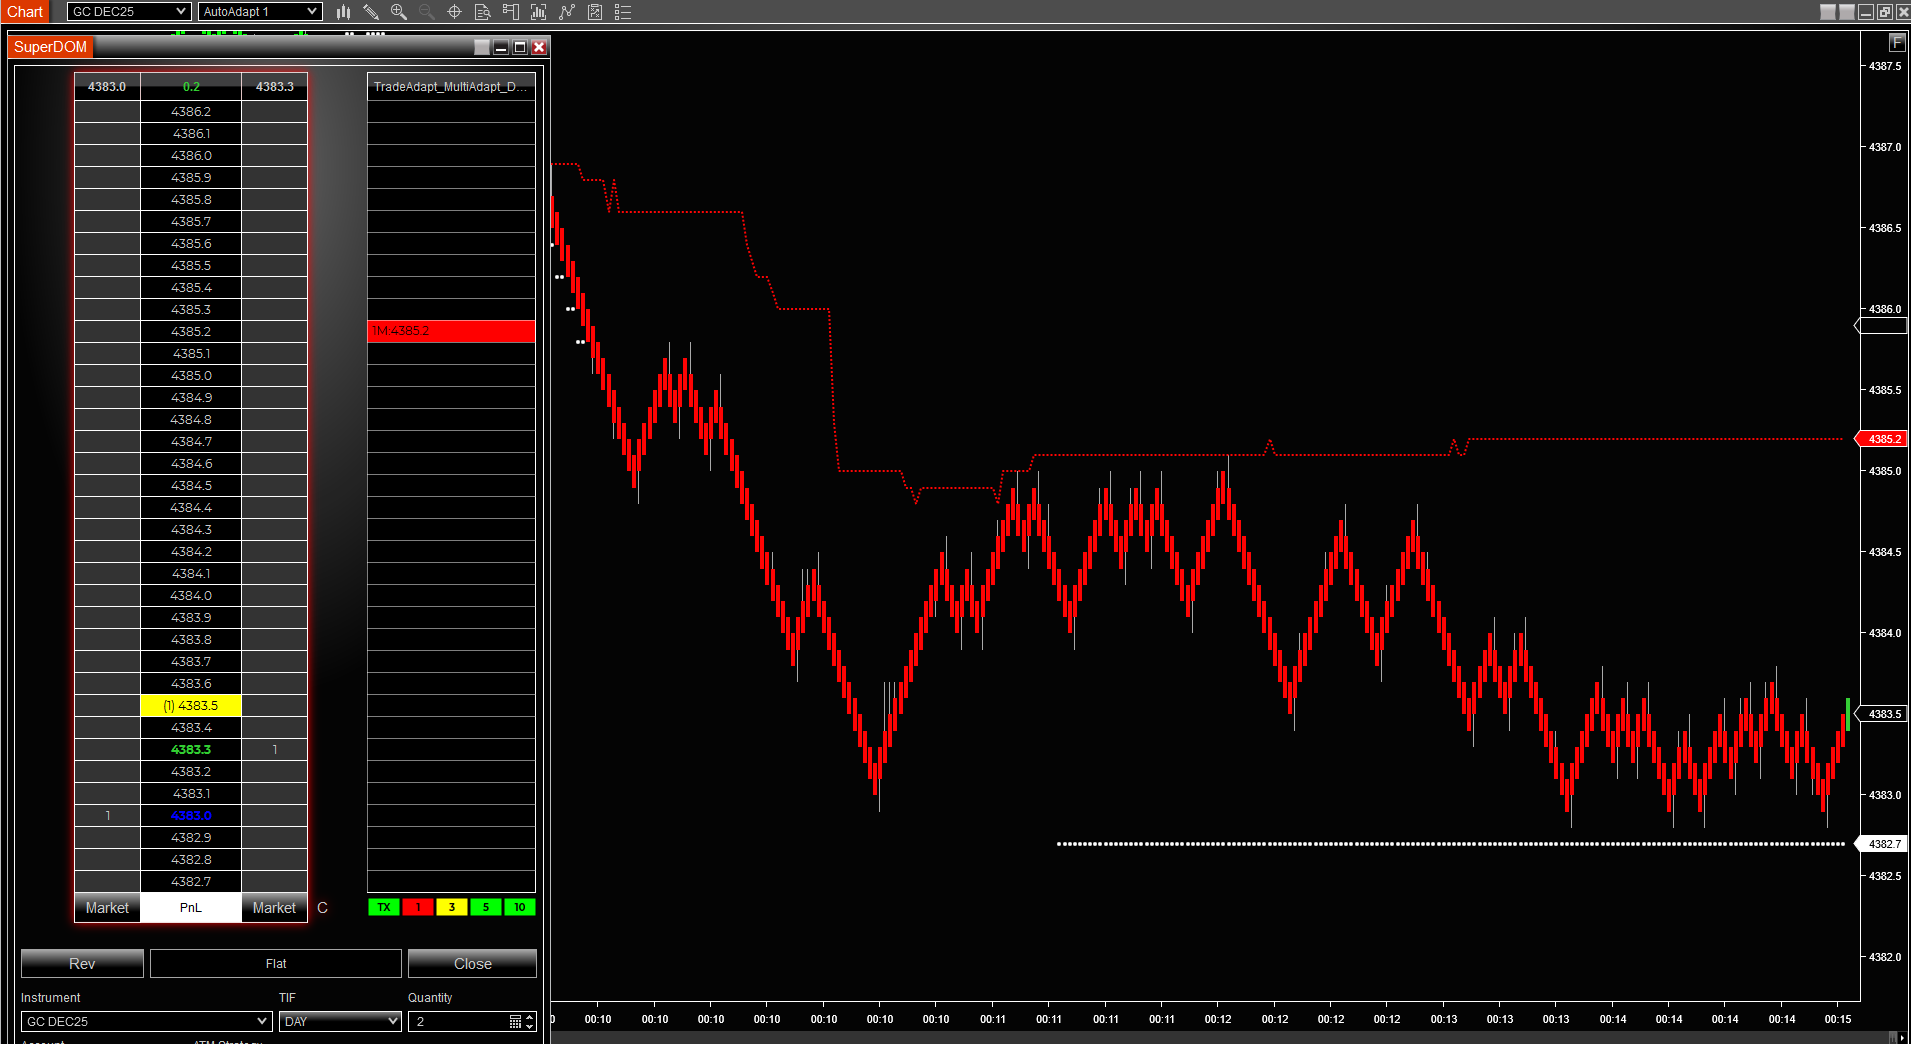
GC chart with DOM overlay in Mid Only mode (click to enlarge)
Custom File Reading
The DOM can read from three custom data sources in addition to the standard MultiAdapt levels. This lets you integrate data from other indicators or strategies:
- Read file 1st: Path to first custom data file
- Read file 2nd: Path to second custom data file
- Read file 3rd: Path to third custom data file
Custom files use the same format: buy,sell,target
Setup Requirements
- Enable “Output MultiAdapt Data” in your MultiAdapt Pro indicator
- Note the label you’re using (default: “X”)
- Add the MultiAdapt DOM column to your SuperDOM
- Enable “Enable File Reading” in the DOM column settings
- Set the file read interval (default: 1 second)
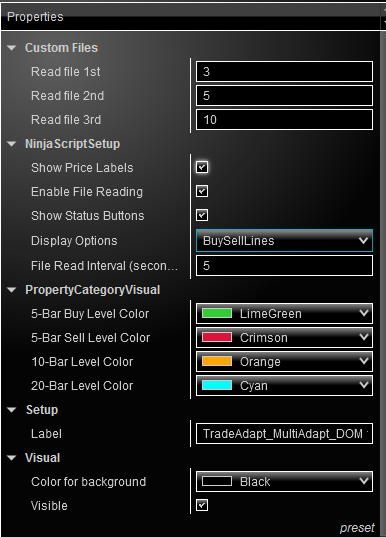
DOM column configuration settings (click to enlarge)
Price Labels
Enable “Show Price Labels” to display the actual price values next to each level in the DOM. Useful for precision order placement.
Practical Application
Finding High-Probability Setups
Look for price action near levels where multiple timeframes converge. When the 4x, 6x, and 8x timeframe levels cluster together, you’re seeing agreement across timeframes – that’s where the market often makes decisions.
Reading Divergence
When shorter timeframes show reversal signals but longer timeframes don’t, you’re seeing potential continuation rather than a true reversal. MultiAdapt Pro makes this immediately visible.
Scaling Strategy
Use the target system to scale out of positions. Take partial profits at TGT1, more at TGT2, and so on. Let the longest timeframe’s structure guide your profit-taking.
Configuration Tips
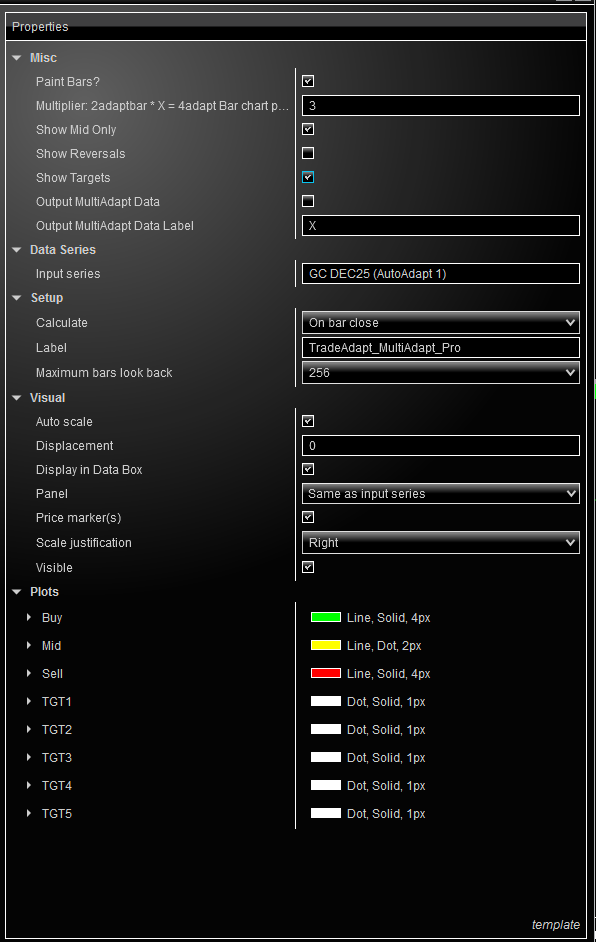
Configuration panel showing all available settings (click to enlarge)
Choosing Your Multiplier
Start with Multiplier = 1 and adjust based on your trading style:
- Scalpers: Multiplier 1 (tighter timeframe separation)
- Day traders: Multiplier 2-3 (moderate separation)
- Swing traders: Multiplier 4+ (wider separation)
Chart Clarity
If your chart feels crowded, enable “Show Mid Only” to reduce visual noise while maintaining awareness of multi-timeframe structure.
Using With Other Tools
MultiAdapt Pro works alongside your other analysis tools. The levels are adaptive and update in real-time as market structure evolves, complementing static support/resistance or indicator-based systems.
Support & Resources
Visit TradeAdapt.ai for:
- Installation guides
- Video tutorials
- Community discussion forums
- Updates and new features
Questions about specific implementation details? The code is open source – examine the logic, modify it, make it yours.