TradeAdapt
ADAPTIVE FIB
- Adapts to Time and Volume
- Real-Time Institutional Levels
- Automated Position Management
- Built for Active Traders
🎥 Watch the Video Breakdown
See how Multi-Timeframe Adaptive Fibonacci works in real-time
The Edge: What You’re Actually Seeing
This isn’t just another Fibonacci tool. Here’s what makes it different.
It’s Not Predictive – It’s Reactive
Most trading systems try to predict what will happen next. This system doesn’t predict anything. It observes structure, calculates adaptive levels based on that structure, and shows you when alignment exists or doesn’t exist.
You’re not guessing. You’re reading what’s already there.
It Adapts to Market Structure
Traditional Fibonacci tools draw levels from historical swing points and leave them static. Those levels get stale as market structure evolves.
Adaptive Fib recalculates continuously as new ranges form. When price breaks out of old structure and establishes new structure, the levels adjust. You’re always seeing current structure, not yesterday’s structure.
It Provides Multi-Timeframe Context
Most traders look at one timeframe and make decisions. Professional traders look at multiple timeframes and wait for confirmation.
This system gives you Monthly, Weekly, and Daily structure on a single chart. You can see if timeframes agree or conflict. When they agree, you have an edge. When they conflict, you have confusion – avoid it.
It Shows You What Institutions See
Fibonacci levels aren’t magic – they’re mathematics. And institutional trading desks, algorithmic systems, and professional traders all use Fibonacci extensions to mark key levels.
When you use the same mathematical framework they use, you see where their orders cluster. You see where they’ll defend levels or attack them. You see the battleground before the battle starts.
It Works Across All Markets
This isn’t an ES-only system or a forex-only system. It’s a structure-based framework that applies to anything with price and volume:
- Futures (ES, NQ, YM, RTY, CL, GC, etc.)
- Forex (EURUSD, GBPJPY, AUDUSD, etc.)
- Crypto (BTCUSD, ETHUSD, etc.)
- Stocks (AAPL, TSLA, NVDA, etc.)
- Commodities (Gold, Silver, Oil, etc.)
Learn it once, apply it everywhere.
Timing: Why It Matters
Different timeframes trigger at different moments. Understanding this creates opportunity.
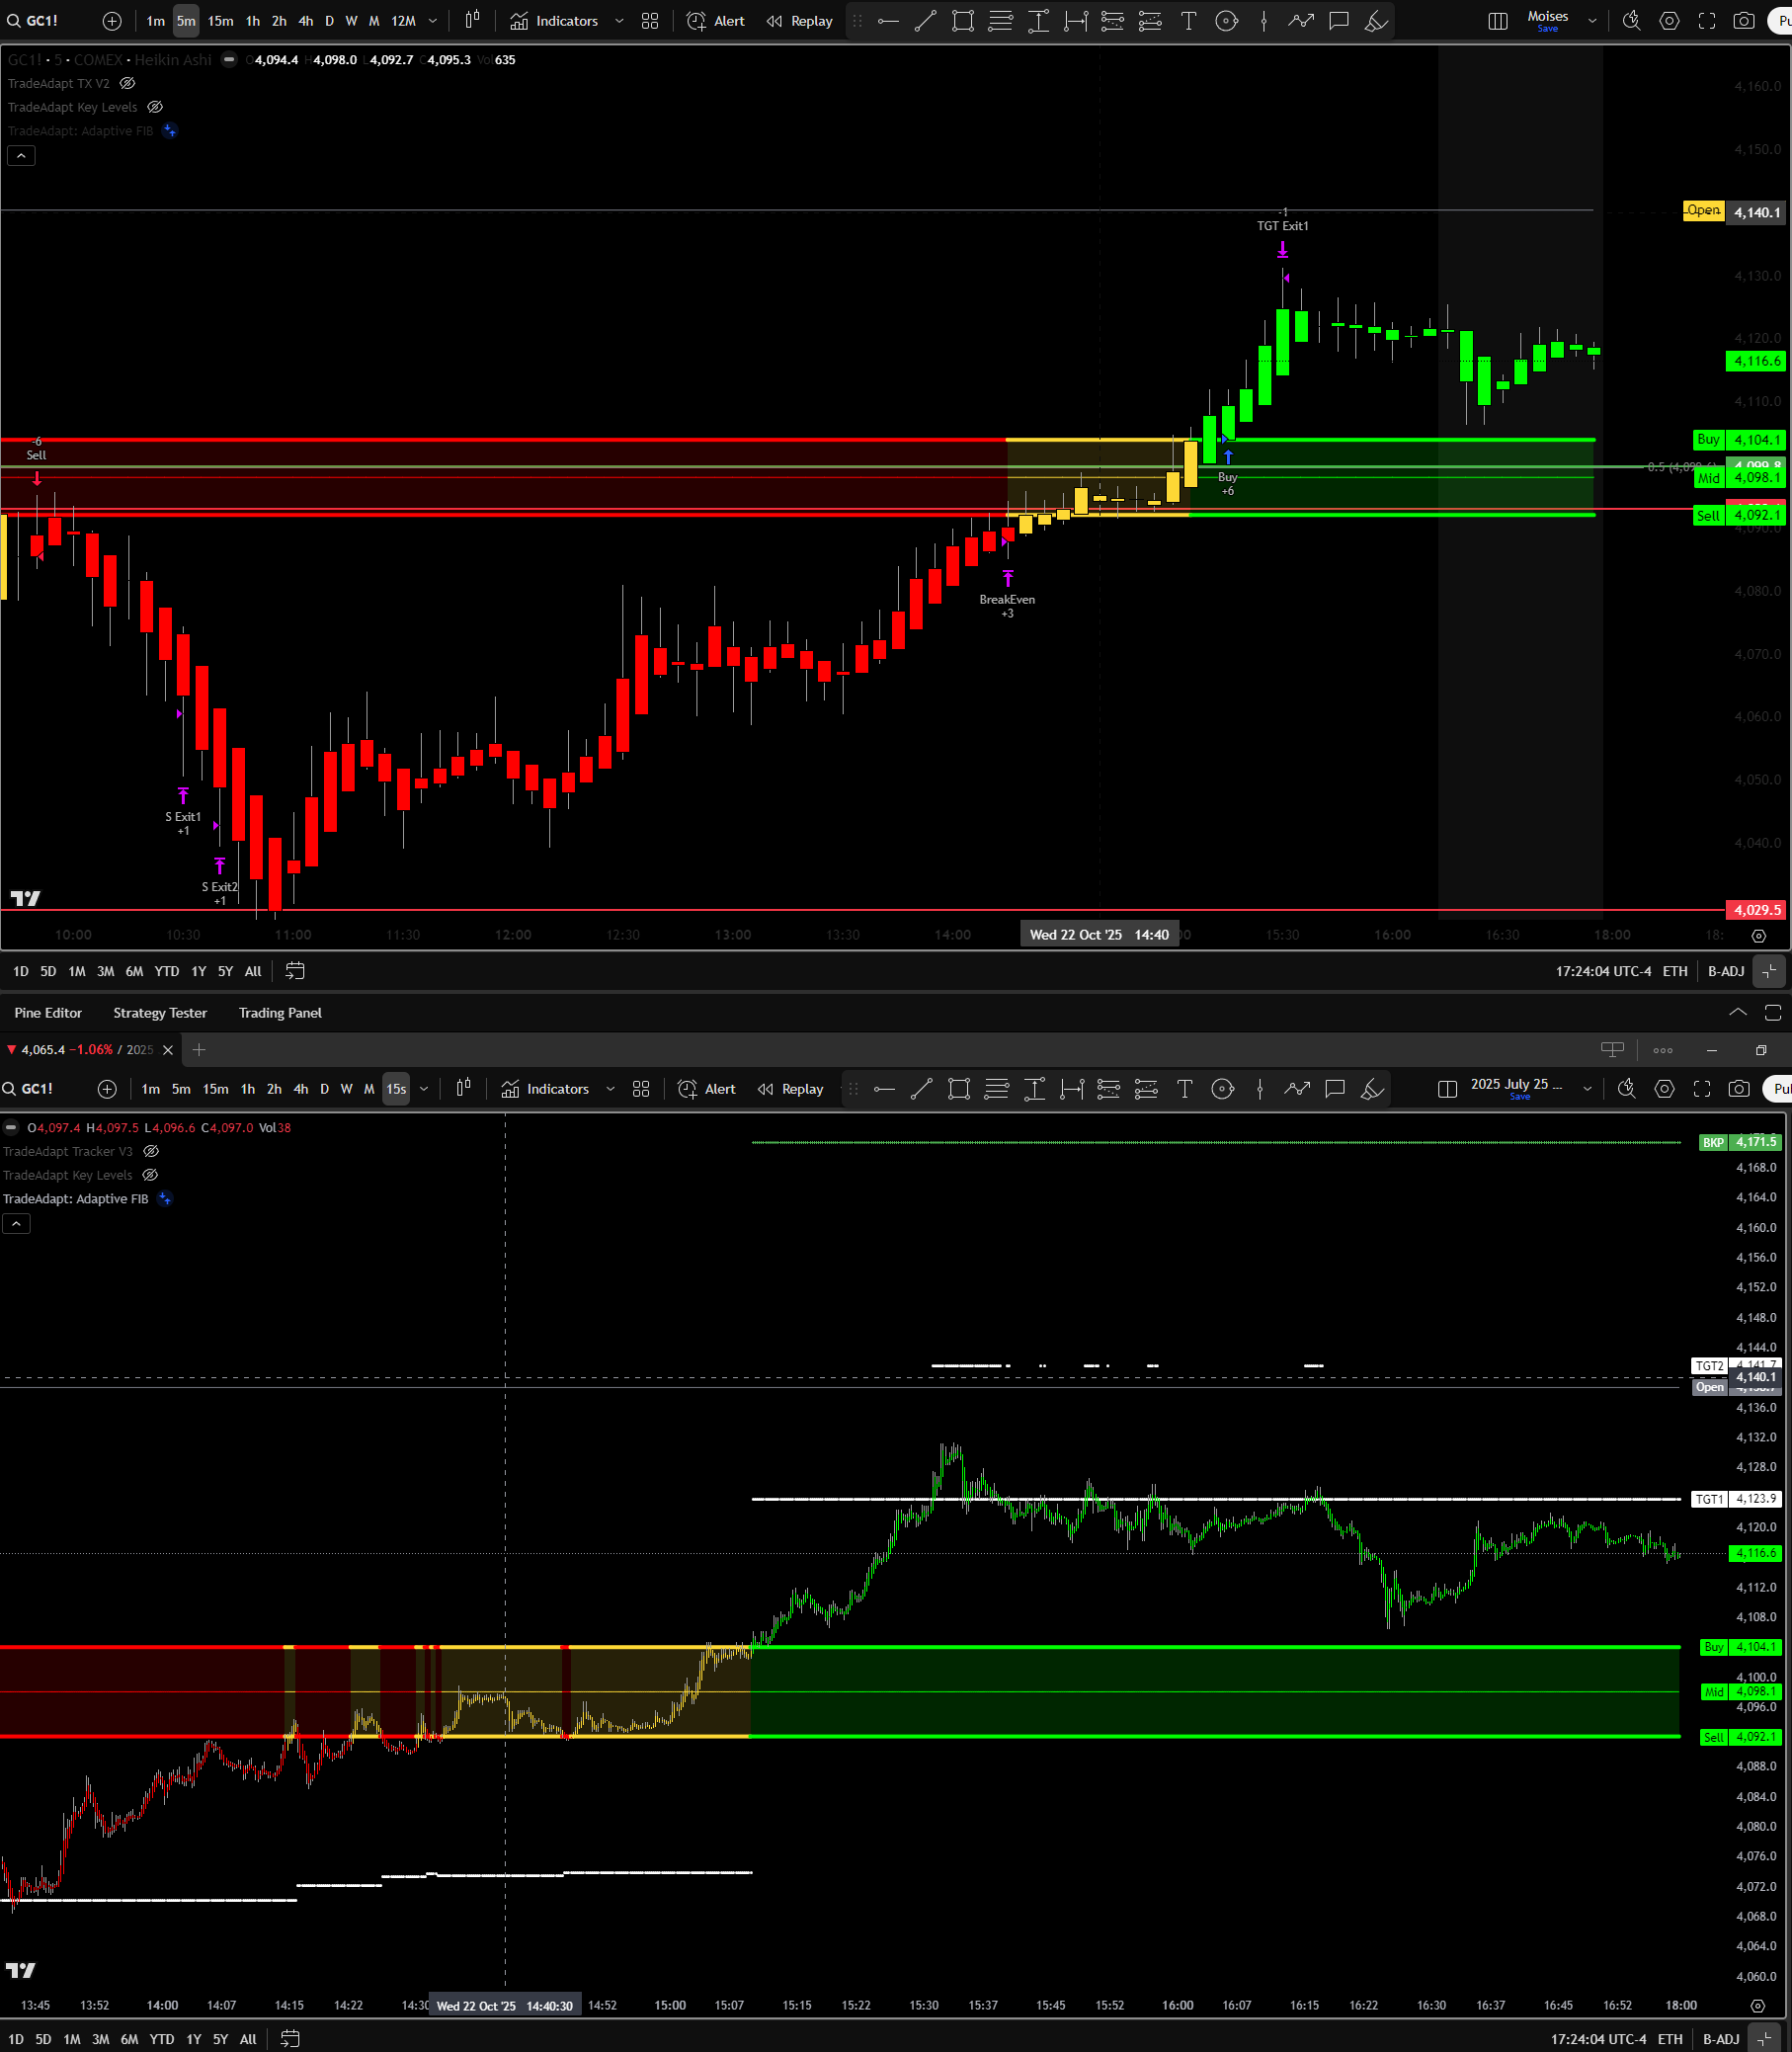
Chart showing timing differential between 15-second and 15-minute timeframes (click to enlarge)
This chart shows the same market on two timeframes simultaneously. Look at the vertical line marking 15:09.
- 15-Second Chart (Top): Buy signal triggered at 15:09 exactly. Fast timeframe = fast response.
- 15-Minute Chart (Bottom): Didn’t trigger until 15:15 – six minutes later when the 15-min bar closed.
The Algorithmic Reality
This timing differential isn’t random. Automated trading systems control when orders hit exchanges. Systems running on 15-second bars send orders every 15 seconds. Systems on 15-minute bars send orders every 15 minutes. High-frequency traders operating at millisecond speeds send orders continuously.
This creates a cascade effect. Fast timeframes trigger first, moving price. Medium timeframes trigger next, adding momentum. Slow timeframes trigger last, confirming the move. Each wave adds liquidity and conviction.
The Heikin Ashi Reality
Critical information for understanding performance and execution.
Why the Results Look So Good
The system is designed for Heikin Ashi charts. These are smoothed candlesticks that reduce noise and clarify trend. When the strategy generates a signal, execution happens at the next bar’s open – at market price.
Here’s the key: On Heikin Ashi charts, the next bar’s open is calculated using averaged values. For buy signals, the HA open will typically be LOWER than actual market price. For sell signals, it will be HIGHER. This averaging creates more favorable fills than you’d get on standard candles.
How to Trade It Live
Don’t expect identical live results to backtests. Use the system as a structural framework, not a mechanical entry generator. Here’s the recommended approach:
- Keep it on Heikin Ashi: The smoothing helps identify trend direction clearly.
- Watch a Standard Chart Too: Monitor actual price on regular candles for precise entry timing.
- Think Longer Term: View the Buy/Sell lines as the macro trend, not tick-perfect entries.
- Use Higher Timeframe Input: Weekly/Monthly ATR timeframes filter noise and show institutional structure.
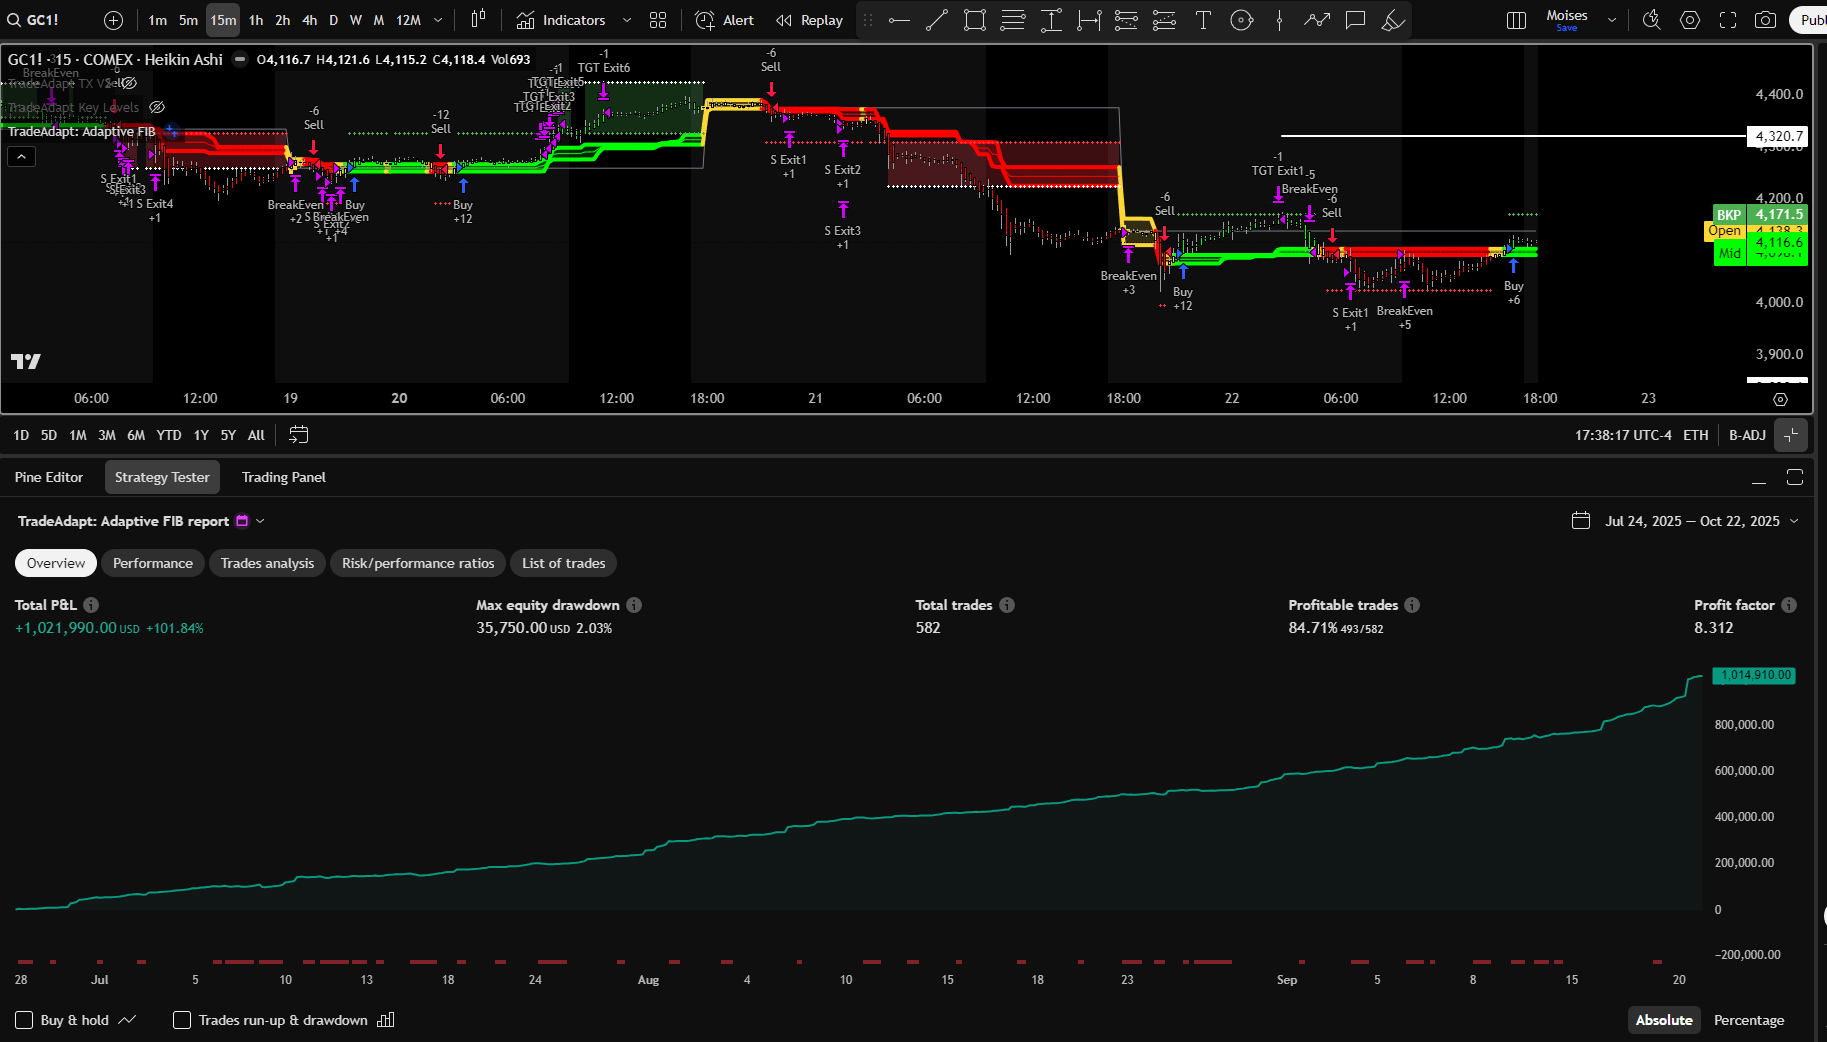
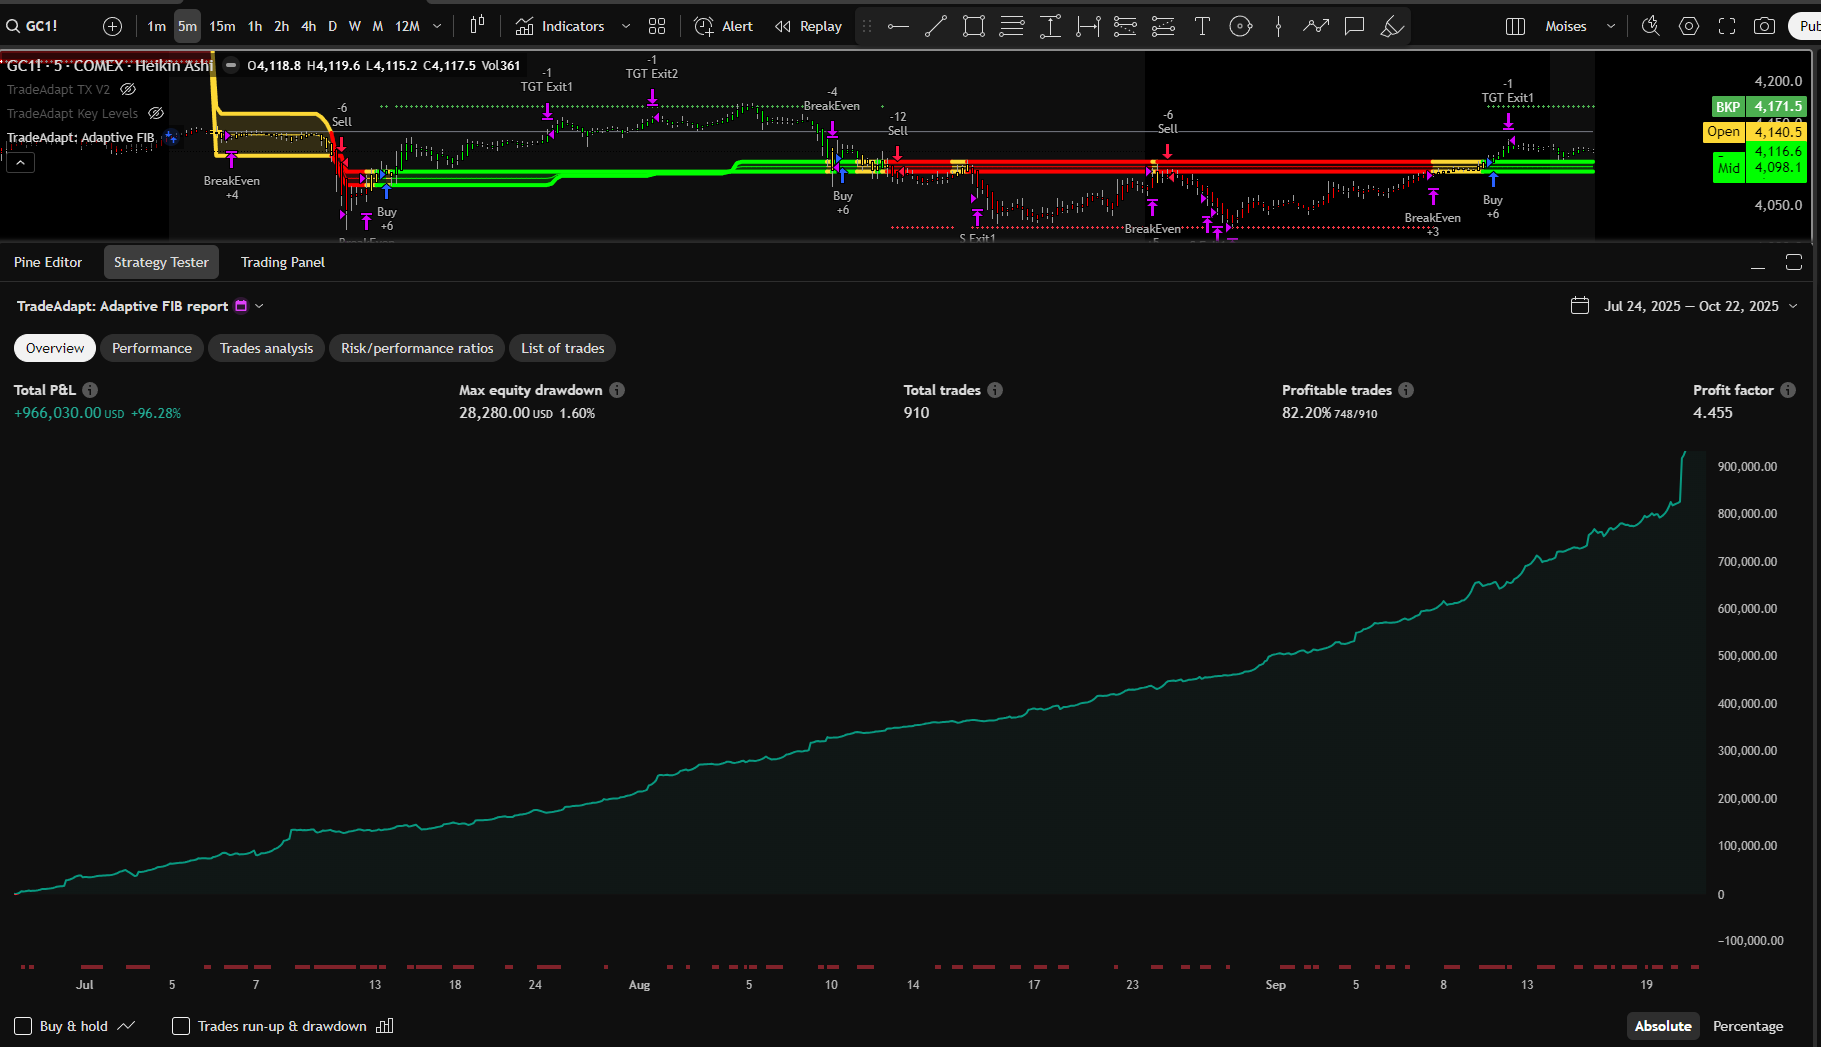
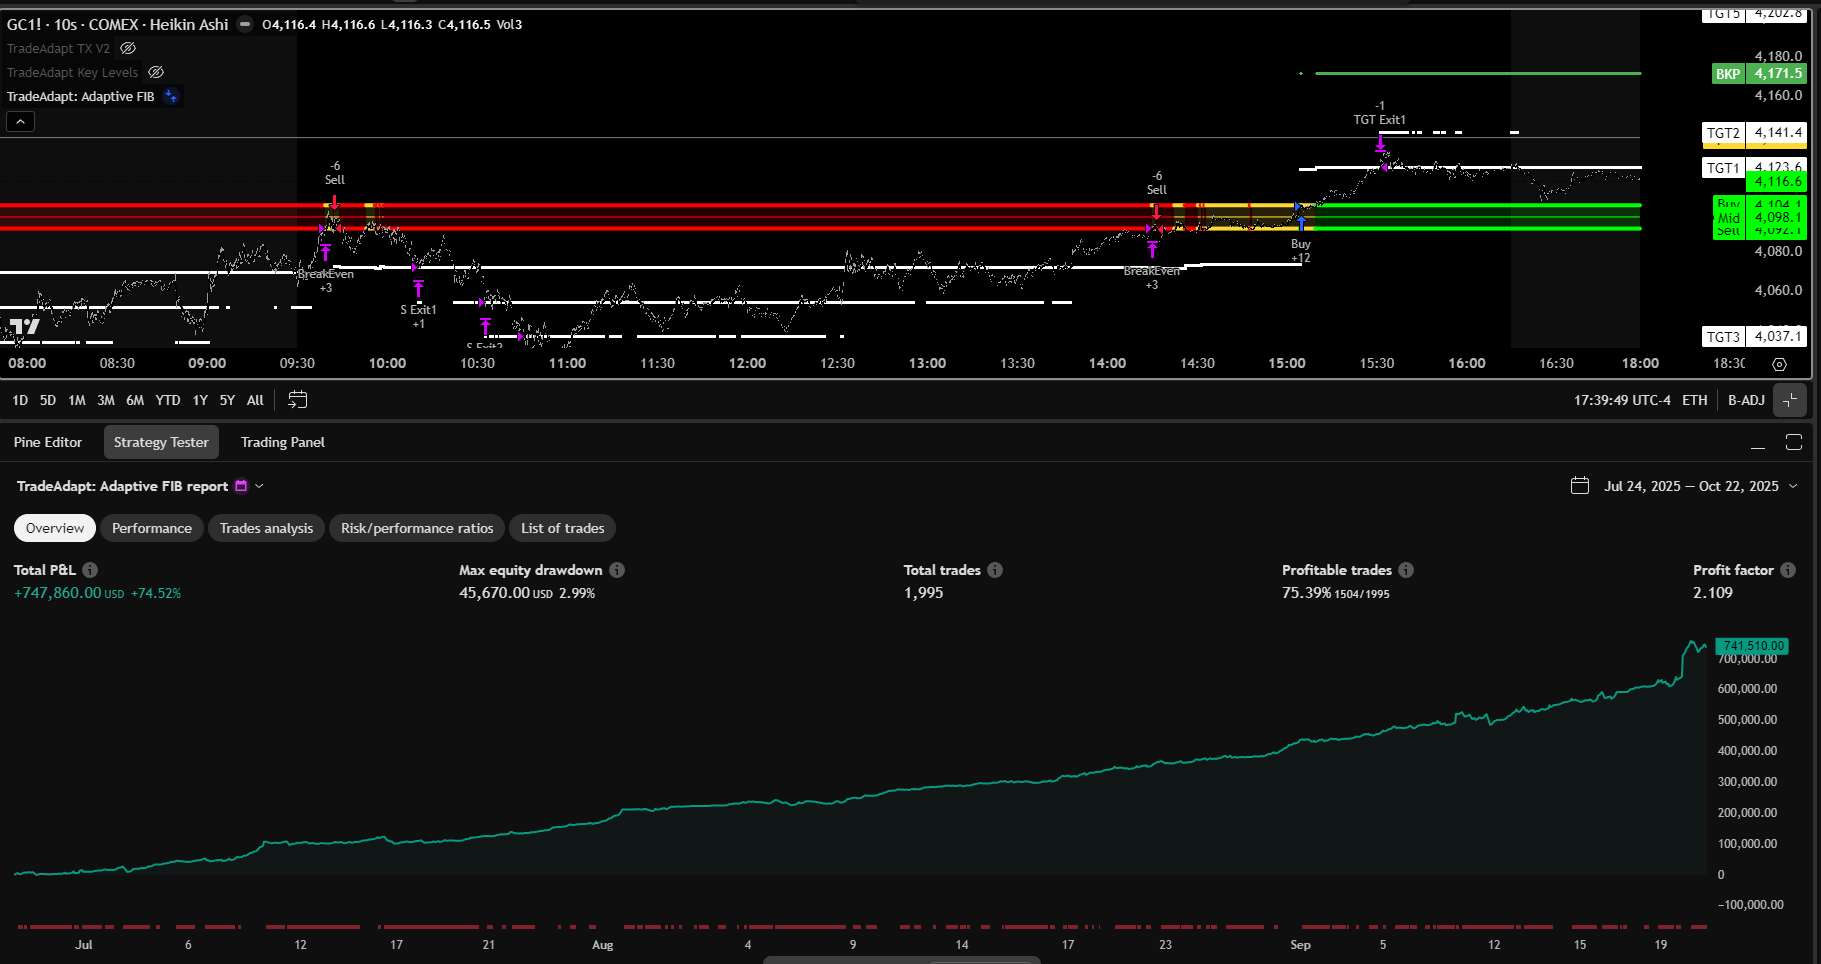
Performance Data
Real backtested results on Gold futures. Same settings, different timeframes. Examine the equity curves and statistics – they tell the story.
15-Minute Chart
5-Minute Chart
10-Second Chart
What This Means
Shorter timeframes = more trades = more noise. The 10-second chart generates nearly 2,000 trades but has the lowest profit factor. You’re trading every wiggle.
Longer timeframes = fewer trades = cleaner signals. The 15-minute chart generates only 582 trades but achieves the highest profit factor. You’re trading actual moves, not noise.
User Guide: Installation & Setup
Get the system running correctly in 3 steps. Takes less than 60 seconds.
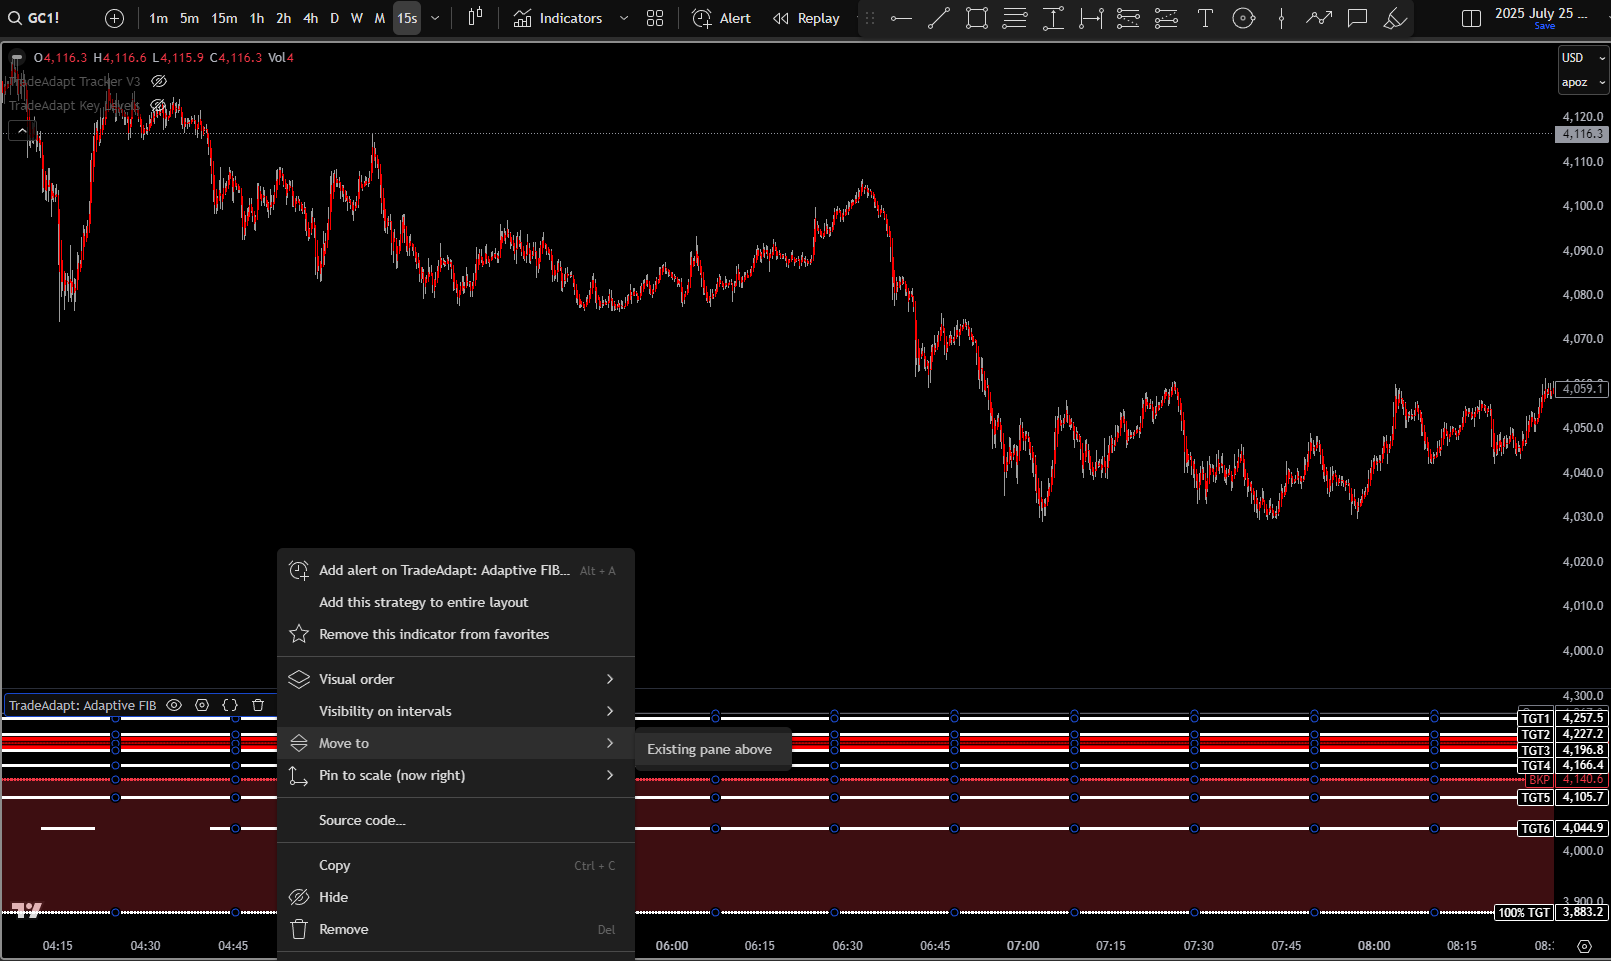
Step 1: Move to Price Chart
After adding the indicator, it appears in the lower panel by default. Right-click the indicator name → select ‘Move to’ → ‘Existing pane above’. This places it on your main price chart where it belongs.
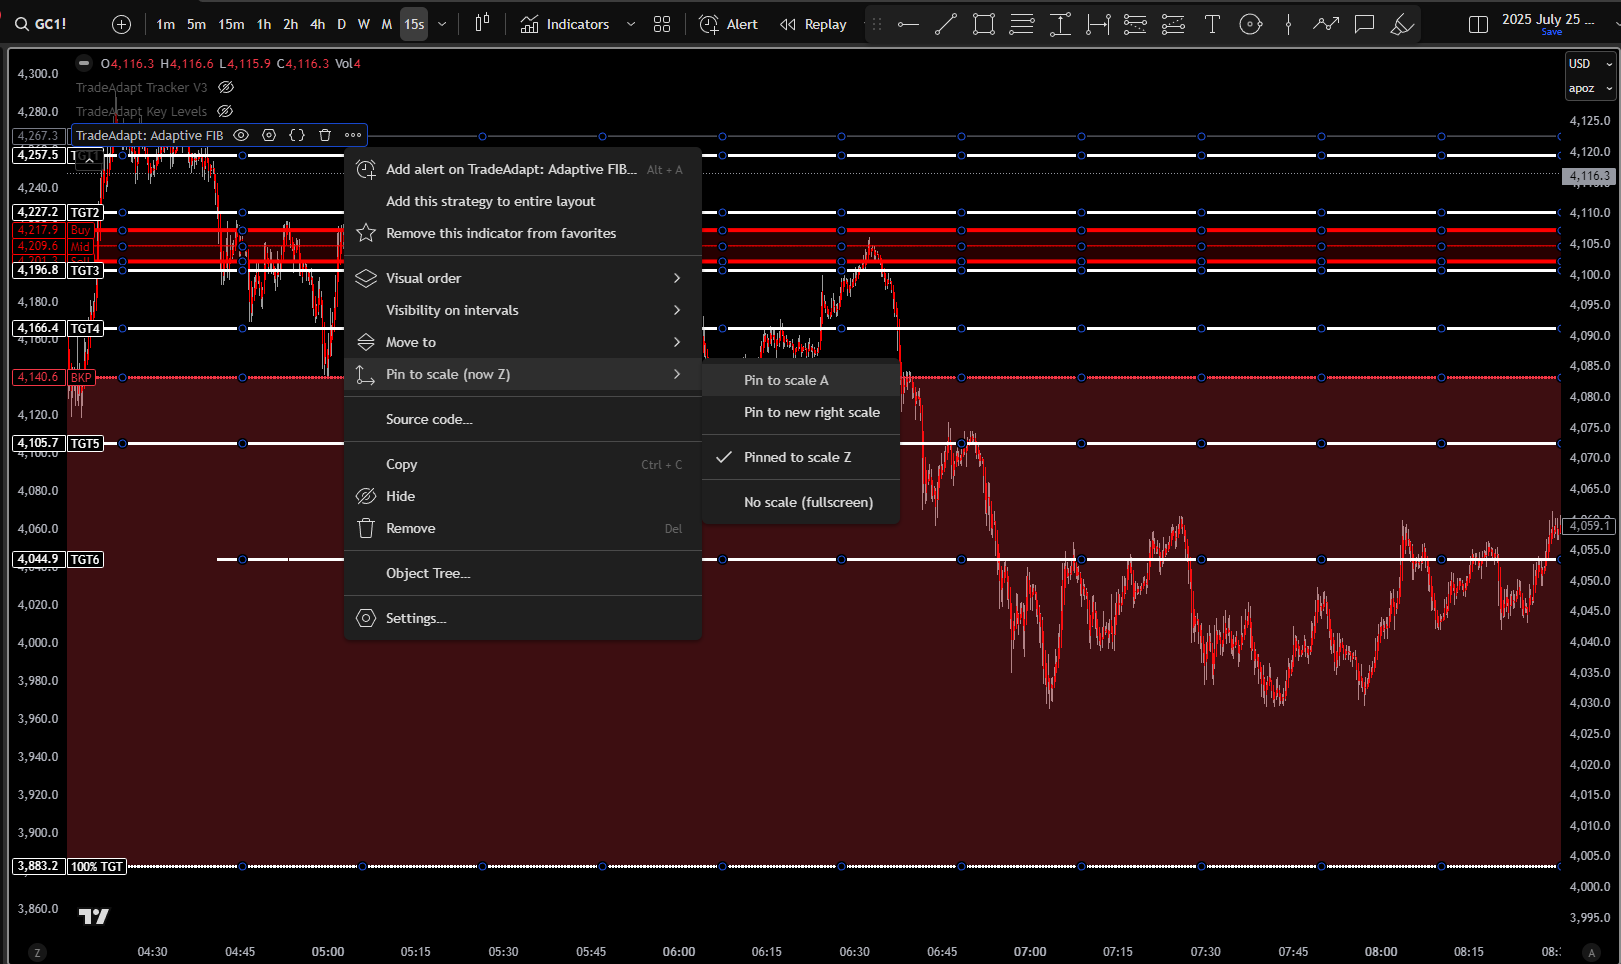
Step 2: Pin to Scale
Right-click the indicator → ‘Pin to scale’ → select ‘Scale A’. This ensures price labels display clearly without overlapping your main price axis. The system is designed this way for maximum clarity.
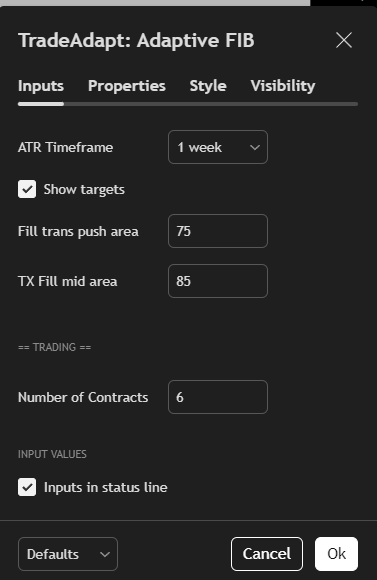
Step 3: Configure (Optional)
Default settings work well for most traders. If you want to adjust, right-click → Settings. The key parameter is ATR Timeframe – we recommend keeping it on 1 Week for intraday trading.
Reading the System
Every visual element communicates market state. Here’s how to read it.
The Lines
- Buy (Top Line): Bulls must hold above this. Break above = bullish structure confirmed.
- Sell (Bottom Line): Bears must break below this. Break below = bearish structure confirmed.
- Mid (Center Line): Neutral zone. Price here = no clear direction yet.
- BKP (Breakpoint): The 50% extension. Price holding here signals commitment to the move.
The Colors
- Green Background: Bulls in control. Price above Buy line and holding.
- Red Background: Bears in control. Price below Sell line and holding.
- Intense Coloring: 100% target reached. Measured move complete. High conviction zone.
The Targets
Target levels (TGT1-TGT6) appear progressively. They mark extensions at 50%, 100%, 150%, 200%, 300%, and 400% of the measured range. Each target represents a natural profit-taking zone where institutions scale out.
Configuration Reference
Quick reference for all available settings.
Settings panel showing all available configuration options (click to enlarge)
Essential Settings
ATR Timeframe: 1 Week (default)
Controls which timeframe drives the range calculation. Weekly works for most intraday traders. Daily for scalpers. Monthly for position traders.
Show Targets: Enabled (default)
Displays the six target levels (TGT1-TGT6) as they become active. Disable for a cleaner chart if you don’t use the built-in strategy.
Number of Contracts: 6 (default)
Sets position size for the automated strategy. The system scales out one contract at each target level.
Fill Trans Push Area: 75 (default)
Transparency of the target zone fills (0-100). Lower = more visible. Higher = more subtle. Adjust for personal preference.
TX Fill Mid Area: 85 (default)
Transparency of the neutral zone between Buy and Sell lines. Keep high (80+) to avoid obscuring price action.
Style Controls
The style controls provide the ability to customize which plots are displayed on your chart. Toggle individual elements on or off to create your preferred view.
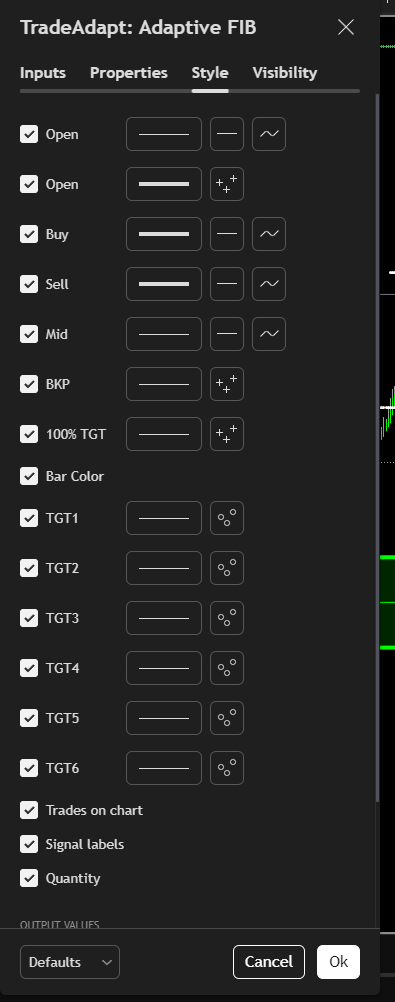
Style controls allow you to customize which plots are shown on the chart (click to enlarge)
The 100% Target: Critical Mass
The most important level in the entire system. When price reaches the 100% target with time remaining, market behavior becomes highly predictable.
What the 100% Target Means
The 100% target represents a complete measured move – the full Fibonacci extension from the reference timeframe range. When price reaches this level, it has traveled the entire projected distance. This is where the magic happens.
At 100%, the system activates intense background coloring. This visual signal tells you: measured move complete, critical mass achieved, high conviction zone active. This isn’t arbitrary highlighting – it marks a fundamental shift in probability.
The Time Remaining Rule
The momentum that carried price to 100% doesn’t just stop. It keeps pushing. If you’re using a Weekly ATR timeframe and price hits 100% on Tuesday or Wednesday, you can expect the market to close Friday (end of week) at or near the extreme.
This is because institutional algorithms, momentum players, and systematic strategies are all programmed to ride these extensions. Once critical mass is reached with time remaining, everyone piles in for the continuation. The math works. The probabilities favor follow-through.
Real Example: Bitcoin Weekly Breakout
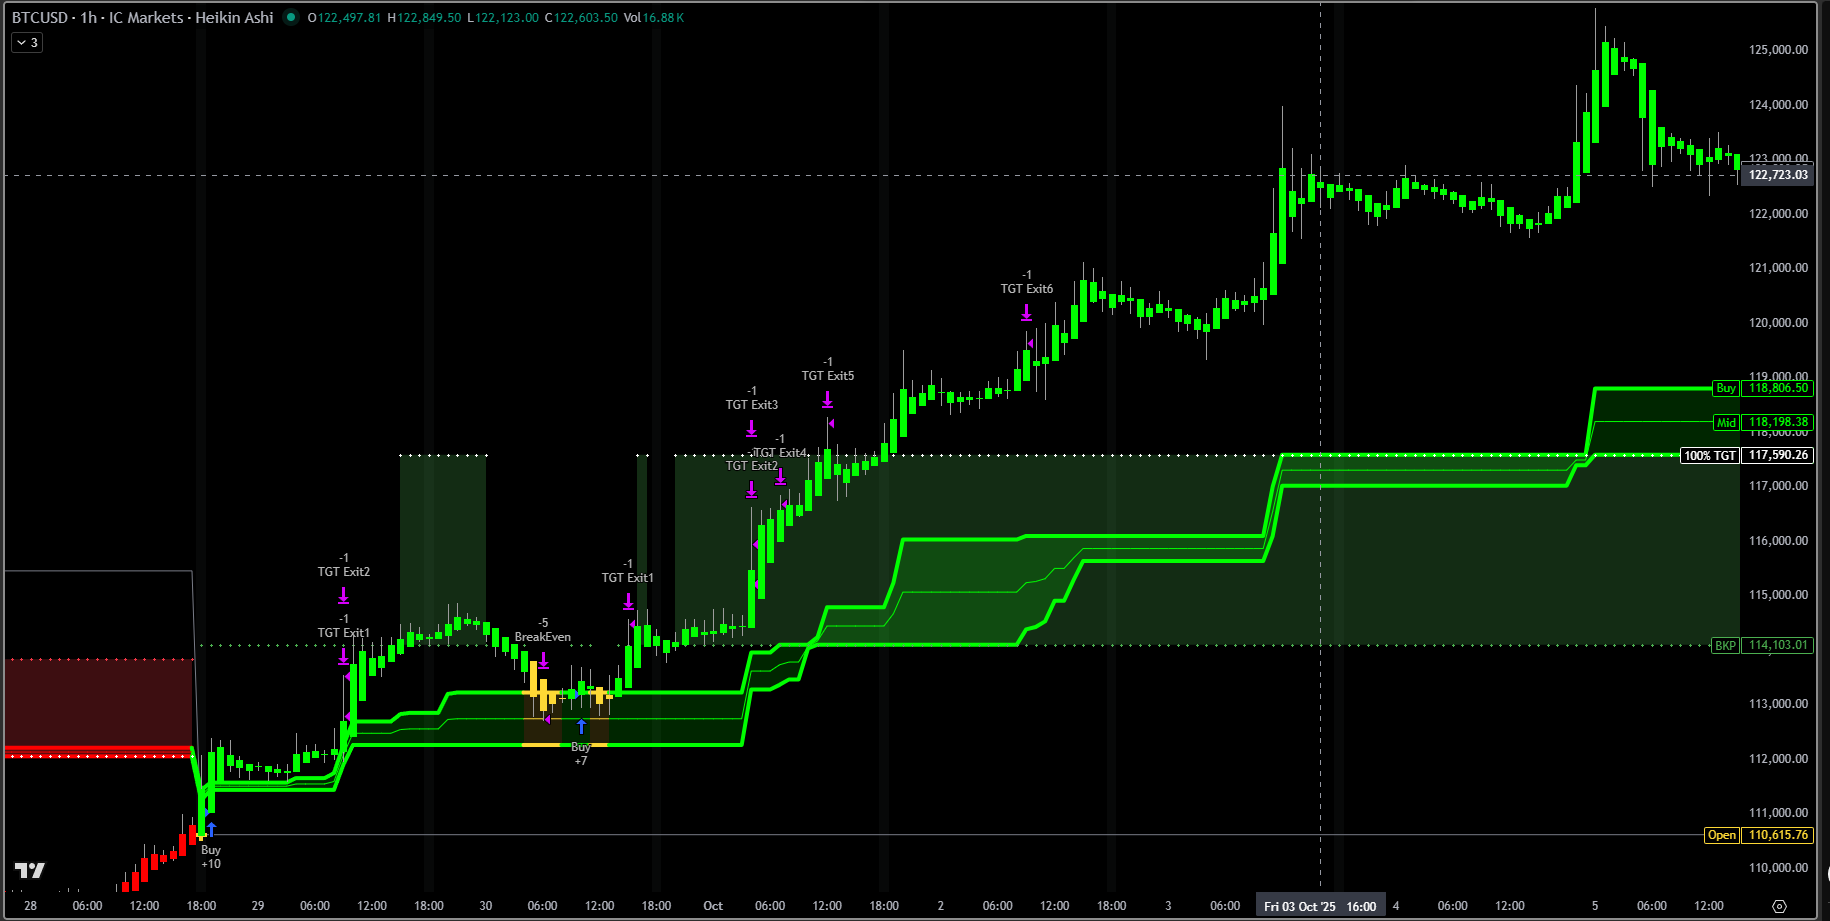
Bitcoin chart showing 100% target breakout with continuation through week end (click to enlarge)
This Bitcoin chart using Weekly ATR timeframe demonstrates the 100% rule perfectly:
Wednesday: Price broke above the 100% target (green 100% TGT line at ~117,590). Three days remained until weekly close.
Thursday-Friday: Continued push higher. The green zones stair-stepped upward as the system adapted to new structure.
Friday Close: Week closed near the high around 122,700 – exactly as the 100% rule predicts. The move that started Wednesday carried through to end of week.
Trading the 100% Level
This creates actionable strategies:
- Continuation Trades: When 100% breaks with time remaining, consider adding to positions or entering new ones. The probability favors continuation through period close.
- Stock Scanning: For equities, scan on Tuesday/Wednesday for stocks beyond their Weekly 100% targets. Look for continued moves through Friday close.
- Time-of-Week Plays: Mid-week 100% breaks are higher conviction than Thursday/Friday breaks. More time remaining = more continuation potential.
- Exit Strategy: If you’re long and price hits 100% late Friday (weekly timeframe), consider taking profits. Little time remains for continuation.
Why This Works
The 100% target isn’t magic – it’s mathematics meeting market psychology. Fibonacci extensions are reference points used across the industry. When a widely-watched level breaks with conviction (time remaining to prove it), participants react predictably.
Momentum traders see the breakout and jump in. Systematic strategies trigger continuation algorithms. Option dealers hedge their exposure, creating more buying pressure. Late-week close becomes a self-fulfilling prophecy as everyone tries to be positioned correctly before the timeframe resets.
100% as Its Own System
For stock traders, this can be an entire strategy:
- Run Weekly ATR scans on Tuesday morning
- Identify stocks trading above their 100% targets
- Confirm background coloring is active (high conviction)
- Enter positions expecting continuation through Friday
- Exit Friday close or when price shows reversal signs
Simple. Systematic. Based on observable market structure rather than prediction. The 100% target is where Adaptive FIB transitions from analysis tool to actionable strategy.
Final Thoughts
How to think about this tool and use it effectively.
It’s a Framework, Not a Robot
Don’t expect to blindly follow every signal and print money. The backtests look good because they’re on Heikin Ashi with favorable execution timing. Real trading has slippage, spreads, and market impact.
Instead, use this system to see market structure the way institutions see it. The Buy and Sell lines show you where the battle happens. The BKP shows you who’s winning. The background coloring tells you when conviction is high. This is information – what you do with it is up to you.
Test Before Trading
Use TradingView’s strategy tester. Run it on different timeframes, different markets, different periods. Understand how it behaves in trending markets versus choppy markets. Learn what conditions produce the best signals.
Then paper trade it live. Watch how your entries differ from backtest fills. See how the levels perform in real-time versus historical. Build confidence before committing capital.
The Bigger Picture
Markets are about liquidity and order flow. Big players move size – they can’t hide. They leave footprints at key levels. Fibonacci relationships emerge because participants reference the same mathematical structures.
Adaptive FIB reveals those footprints in real-time. You’re not predicting – you’re observing. The system adapts as structure evolves. The levels shift as new ranges establish. You see what’s happening now, not what happened yesterday.
Get Support
Visit TradeAdapt.ai for updates, documentation, and community discussion. Questions about implementation? Check the support forums. Want to understand the code? It’s open source – dig in.
RISK DISCLOSURE & DISCLAIMER
PAST PERFORMANCE IS NOT INDICATIVE OF FUTURE RESULTS
The performance data and backtested results presented in this guide are hypothetical and do not represent actual trading. Hypothetical performance results have inherent limitations, including but not limited to the fact that they do not reflect actual trading, market liquidity constraints, or the impact of fees and commissions.
No representation is being made that any account will or is likely to achieve profits or losses similar to those shown. Actual results may vary significantly from the hypothetical results presented.
TRADING INVOLVES SUBSTANTIAL RISK
Trading futures, forex, stocks, and other financial instruments involves substantial risk of loss and is not suitable for every investor. The high degree of leverage can work against you as well as for you. Before deciding to trade, you should carefully consider your investment objectives, level of experience, and risk appetite.
THE SYSTEM IS A TOOL, NOT INVESTMENT ADVICE
The Adaptive FIB system is provided for informational and educational purposes only. It is not investment advice, nor is it a recommendation to buy or sell any security or financial instrument. Users are solely responsible for their own trading decisions and should consult with a licensed financial advisor before making any investment decisions.
HEIKIN ASHI EXECUTION CONSIDERATIONS
The backtested results shown utilize Heikin Ashi candlesticks, which provide smoothed price action and averaged open values. This creates more favorable backtest fills than standard candlestick execution in live markets. Live trading results will differ from backtested results due to execution timing, slippage, market impact, and the difference between Heikin Ashi calculations and actual market prices.
NO WARRANTY
The software and system are provided “as is” without warranty of any kind, either express or implied, including but not limited to warranties of merchantability, fitness for a particular purpose, or non-infringement. TradeAdapt.ai does not warrant that the system will be error-free, uninterrupted, or meet your requirements.
LIMITATION OF LIABILITY
In no event shall TradeAdapt.ai, its owners, employees, or affiliates be liable for any direct, indirect, incidental, special, or consequential damages arising out of or in connection with the use of this system, even if advised of the possibility of such damages.
By using the Adaptive FIB system, you acknowledge that you have read, understood, and agree to this disclaimer and risk disclosure.
© 2025 TradeAdapt.ai | All Rights Reserved